57 Handy Stats for Non-Profit Marketers for 2016
I’ve thrown together 57 handy stats for non-profit marketers to provide some fresh insight into donations, charitable giving, fundraising and non-profit marketing strategies for 2016! Take a gander, enjoy!
These stats will cover:
- The major trends in donations, charitable giving and fundraising (See stats 1 – 8)
- A good day and time to promote your donations, charitable giving and fundraising (See stats 9 – 13)
- Payment method usage (See stats 14 – 21)
- Donations, charitable giving and fundraising broken down by generations, such as, Baby Boomers and Gen Xers (See stats 22 – 35)
- Promotional strategies for non-profit marketing (See stats 36 – 57)
Contents
The major trends in donations, charitable giving and fundraising
#1
64% of donations are made by women (You go girls!) Source
#2
Americans donated about $358.38 billion to charity in 2014; the highest total in the report’s 60-year history. Source
#3
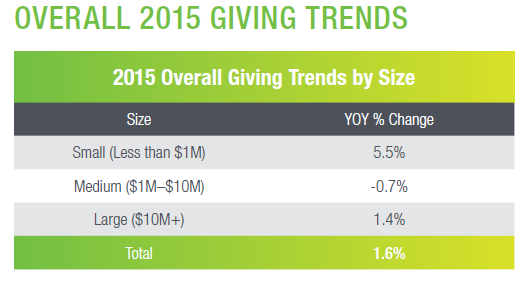
In 2015, overall charitable giving in the US increased 1.6% on a year-over-year basis. Large organizations grew by 1.4%, medium organizations declined 0.7% and small non-profits grew 5.5% compared to the same time period in 2014. Source
#4
2014 Charitable Giving by Source:
Individual giving raked in $258.51 billion, an increase of 5.7 percent in current dollars (and 4.0 percent with inflation-adjusted) over 2013.
Foundation giving brought in a whopping $53.97 billion, which was 8.2 percent higher than in 2013 (the increase was 6.5 percent with inflation-adjusted).
Bequest giving graciously doled out $28.13 billion, an increase of 15.5 percent (13.6 percent with inflation-adjusted) over 2013.
Corporate giving offered up $17.77 billion, that’s an increase of 13.7 percent (11.9 percent with inflation-adjusted) over 2013. Source
#5
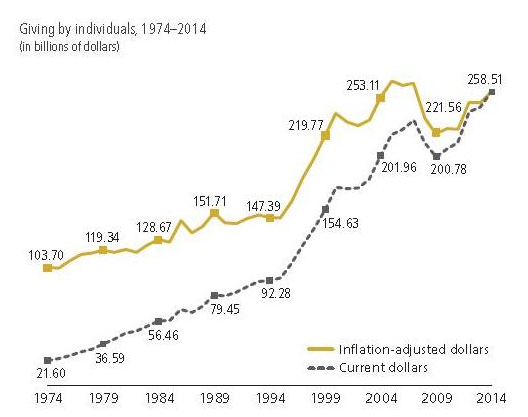
After a slight drop following the most recent recession, individual giving has been on the rise in both current and inflation-adjusted dollars for the last couple of years, although it has not recovered to pre-recession levels. Source
#6
Wondering about the top five types of nonprofits consumers are giving to? 1. Churches and/or places of worship (50%), 2. Local social service organizations (45%), 3. Children’s charities (37%), 4. Health charities (35%), 5. Animal Rescue/Shelter/Protection Charities (25%). Source
#7
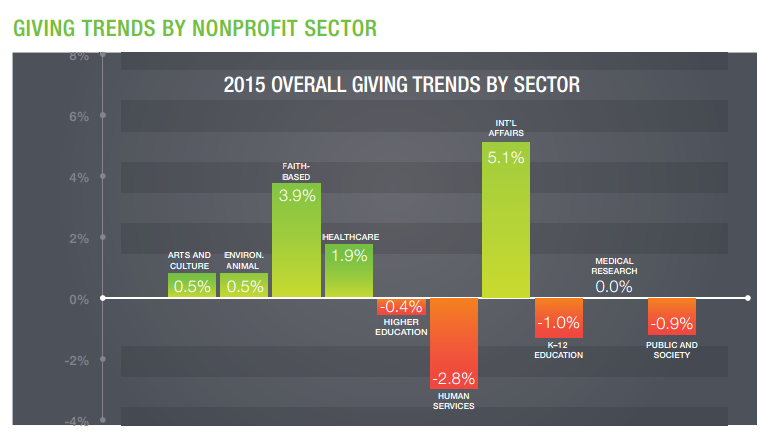
International Affairs organizations had the largest increase in year-over-year fundraising with 5.1 percent growth. This was followed by Faith-based non-profits, with a growth rate of 3.9 percent. Healthcare organizations grew 1.9 percent on a year-over-year basis. Both Arts & Culture and Environment & Animal Welfare sectors grew 0.5% when compared to 2015. There were four sectors (Human Services, Higher Education, Public & Society and K–12 Education) that experienced a year-over-year decline in overall fundraising. Non-profits in the Medical Research sector had flat performance when compared to 2014. Source
#8
2014 Charitable Giving to Recipients:
- Religion— was up at $114.90 billion in 2014, giving increased 2.5 percent in current dollars, and a modest 0.9 percent when adjusted for inflation.
- Education—giving increased to $54.62 billion, 4.9 percent more in current dollars than the 2013 total. The inflation-adjusted increase was 3.2 percent.
- Human Services—its $42.10 billion total was 3.6 percent higher in current dollars in 2014. The inflation-adjusted increase was 1.9 percent.
- Health—the $30.37 billion 2014 estimate was 5.5 percent higher in current dollars than in 2013. When adjusted for inflation, the increase was 3.8 percent.
- Arts & Culture—at an estimated $17.23 billion growth in current dollars was 9.2 percent for 2014. When adjusted for inflation, the increase was 7.4 percent.
- Environment & Animals—The $10.50 billion estimate for 2014 was up 7.0 percent in current dollars, and 5.3 percent when adjusted for inflation, compared to 2013.
- Public-Society Benefit—the $26.29 billion estimate for 2014 increased 5.1 percent in current dollars over 2013. When adjusted for inflation, the increase was 3.4 percent.
- Foundations—at an estimated $41.62 billion in 2014, giving grew 1.8 percent in current dollars and 0.1 percent when adjusted for inflation.
- International Affairs—the $15.10 billion estimate for 2014 decreased 2 percent in current dollars compared to 2013. The drop was 3.6 percent when adjusted for inflation. Source
The best day and time to promote your donations, charitable giving and fundraising
#9
Globally, the total value of mobile donations via PayPal in December of 2012 was 242 percent larger than the year before. Source
#10
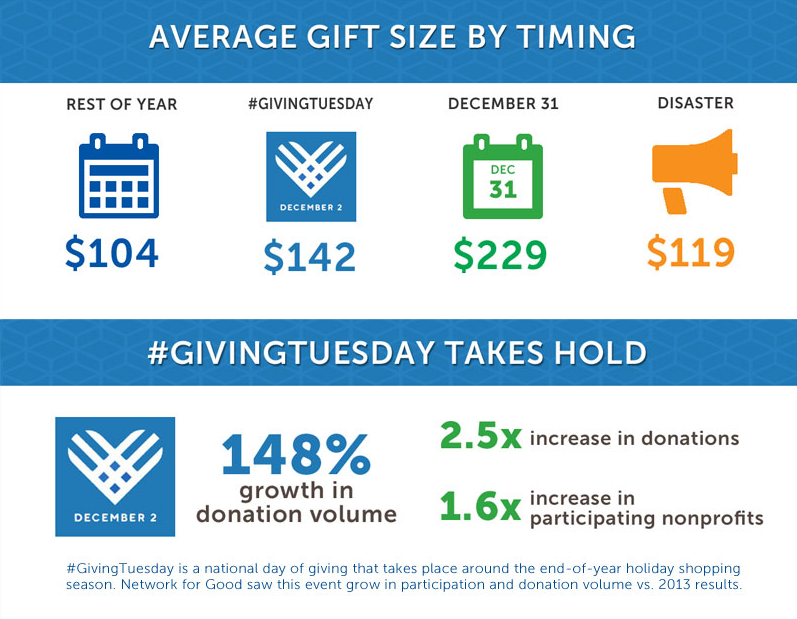
The average gift size throughout the year: #Givingtuesday: $142 – 148% growth in donation volume, December 31: $229, Disaster: $119, Rest of year: $104 Source
#11
A recent COP study focused on high net worth donors (defined as households with income greater than $200,000 with a net worth of over $1,000,000) found that 42.7 percent of those surveyed gave more during the holidays than the rest of the year. However, a generous 44.4 percent reported giving “about the same.” Source
#12
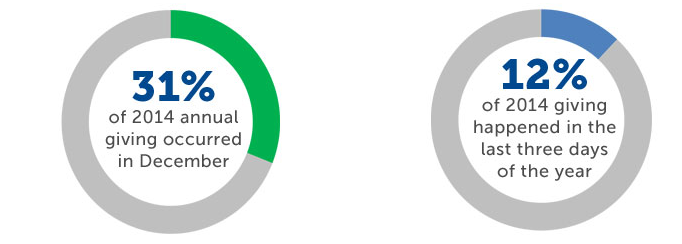
31 percent of 2014’s annual giving occurred in December. 12 percent of 2014’s giving happened in the last three days of the year. Source
#13
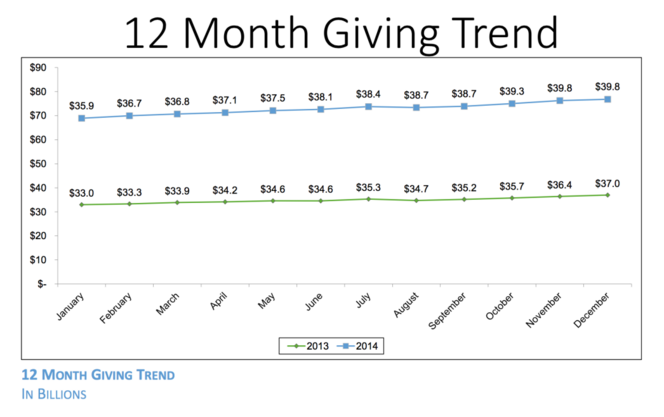
We’re not just seeing an uptick during the holidays, and we’re not just seeing an uptick when people are doing their taxes. What we’re seeing is a solid increases month over month. Source
Payment Methods Usage
#14
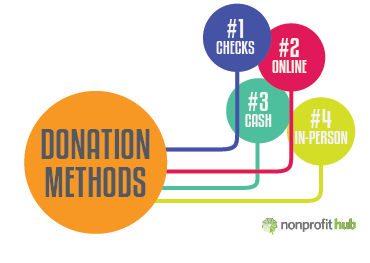
More than 68 percent of those surveyed said the highest volume of donations come in the form of checks, while another quarter said checks were the second most popular donation method. Online credit cards are the second most popular method. In fact, 20 percent of non-profits said credit cards are their highest volume, with 42 percent saying it is number two. Cash stayed in a steady third place, ahead of in-person credit card transactions and ACH. Source
#15
Online donations on #GivingTuesday 2015 were up 52 percent compared to 2014. 17 percent of digital donations were made on mobile devices on last year’s #GivingTuesday. Source
#16
Nearly 14 percent of all online donations in 2015 were made using a mobile device. Data shows that 43 percent of mobile transactions were made on an iPad®, 42 percent using an iPhone®, 14 percent on Android® devices and less than 1 percent using other devices like Blackberry® or the mysterious Windows® Phone. Source
#17
[tweetthis url=”https://www.myloudspeaker.ca/blog/57-handy-stats-for-non-profit-marketers/”] Mobile and tablet dollars were up 96 percent with responsive and mobile dollars were up 126 percent with responsive.[/tweetthis] Source
#18
Donors are 31 percent more likely to initiate a recurring gift on a branded donation page versus a generic one. Brand counts! Source
#19
Online giving grew 9.2 percent in 2015 compared to 2014. Large organizations grew by 9.6 percent, medium sized organizations grew 9.1 percent and small non-profits grew 8.3 percent on a year-over-year basis. Source
#20
A Pew survey of those who donated to the Red Cross by mobile during the 2010 Haiti earthquake showed that 50 percent of people donated immediately through their phone. 43 percent of the donors contacted friends and family from their mobile devices and asked them to give and 76 percent of those pleas were successful, which ultimately led to a viral campaign. Source
#21
PayPal was the top choice with 42 percent of respondents lending their praise. The next option was using a merchant provider such as Heartland Payments or the user’s own bank at 23 percent. Source
Donations, charitable giving and fundraising by Generations
#22
More than 40 percent of all money donated (as reported by study participants) comes from Americans aged 49 to 67 years old, while more than 25 percent comes from Matures, 20 percent from Gen X and 10 percent from Gen Y. Source
#23
The World Vision survey, conducted annually as part of their World Vision Gift Catalogue campaign, revealed that 56 percent of men ages 18-34 have given a charitable gift versus 36 percent of older men (ages 35 and above) and 37 percent of their female counterparts in the same age group. Source
#24
In Blackbaud’s generational giving study, 57 percent of the Millennials surveyed reported a desire to see the impact of their donations directly. “They respond to a culture of innovation,” Tripp says, “Millennials want to be engaged by charity brands that are doing things better, innovating, solving a problem.” Some might even go further. Source
#25
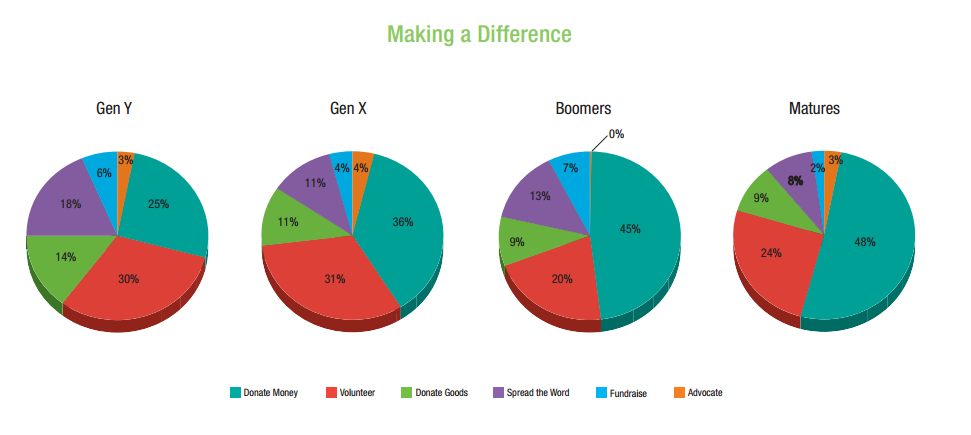
Generation Y: Age 18-32, Generation X: Age 33 -48, Boomers: Age 49 – 67, Matures: Age 68+
Strong pluralities of Matures (48 percent) and Boomers (45 percent) say that monetary donations make the biggest difference. The focus on money, however, declines with age. Only 36 percent of Generation X and 25 percent of Generation Y think they can make the most difference by donating money. Conversely, Gen Y donors believe they can make the biggest difference by volunteering (30 percent) and by spreading the word to others about the charity and its work (18 percent). But while they value volunteering, Gen Y donors are actually less likely than Matures to say they have actually volunteered for a cause in the past year. Source
#26
Gen Y donors are less likely than their older counterparts to say they give more than once a year. Half of Gen X donors say they give more than once a year to their favourite cause, as do 47 percent of Boomers and 45 percent of Matures. By comparison, only 41 percent of Gen Y donors say they give to their top cause more than once a year. Source
#27
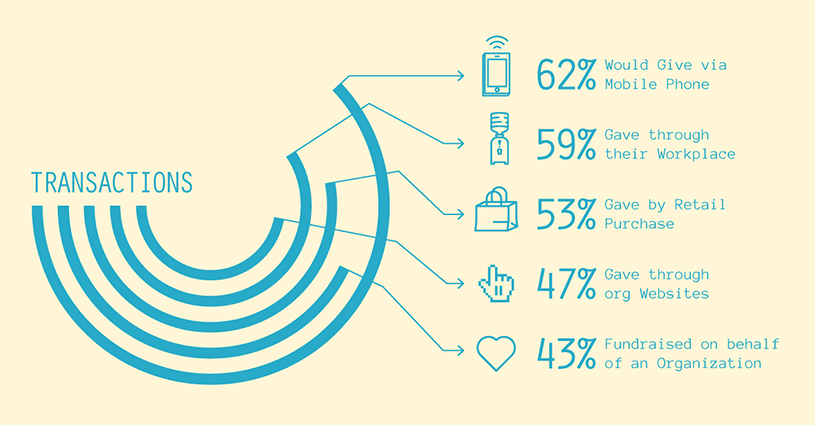
62 percent of Gen Y gave money through their mobile phones, 59 percent gave through their workplace in some way, 53 percent gave through a retail purchase, 47 percent gave through the organization’s website, 43 percent fundraised on behalf of an organization and 60 percent of this generation give an average of $481 per year across 3.3 charities. Source
#28
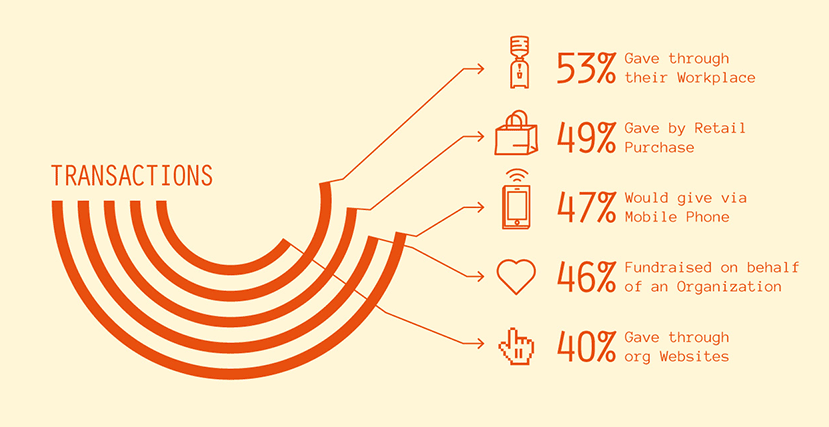
53 percent of Gen X made donations through their workplace, 49 percent donated through a retail purchase, 47 percent gave through their mobile phone, 46 percent fundraised on behalf of an organization, 40 percent gave through the organization’s website and 59 percent of this generation gave an average of $732 per year across 3.9 charities. Source
#29
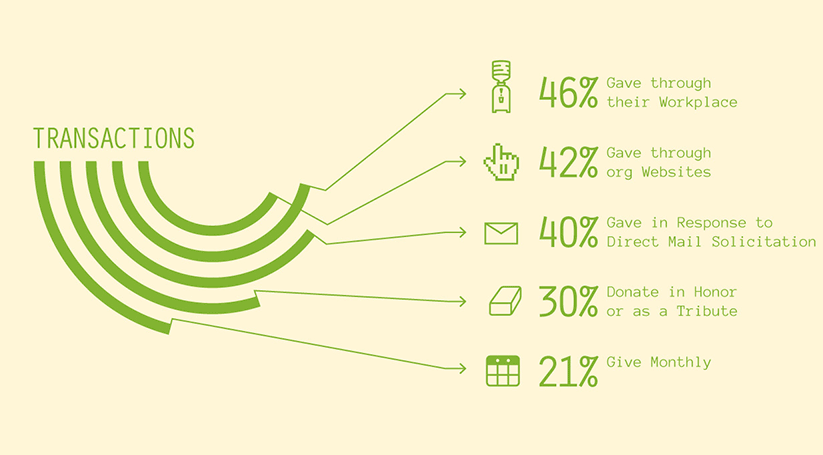
46 percent of Baby Boomers made donations through their workplace, 42 percent gave through the organization’s website, 40 percent donated in response to direct mail solicitation, 30 percent donated in honor or as a tribute, 21 percent give monthly and 72 percent of Baby Boomers gave an average of $1,212 per year across 4.5 charities. Source
#30
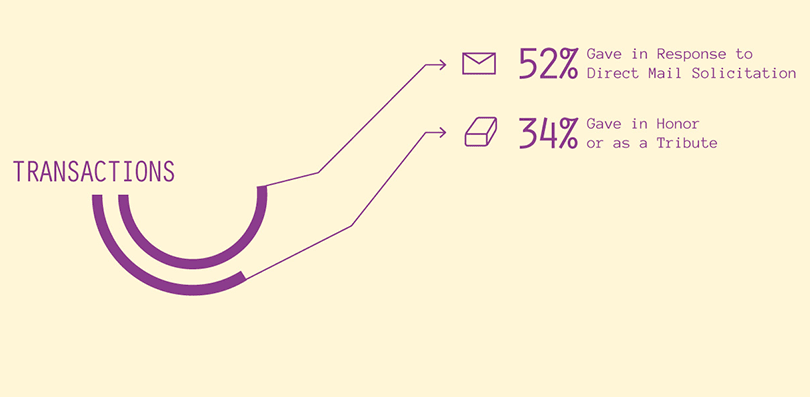
52 percent of Matures donated in response to a direct mail solicitation, 34 percent gave in honor or as a tribute, 88 percent of this generation gave an average of $1,367 per year across 6.2 charities. Source
#31
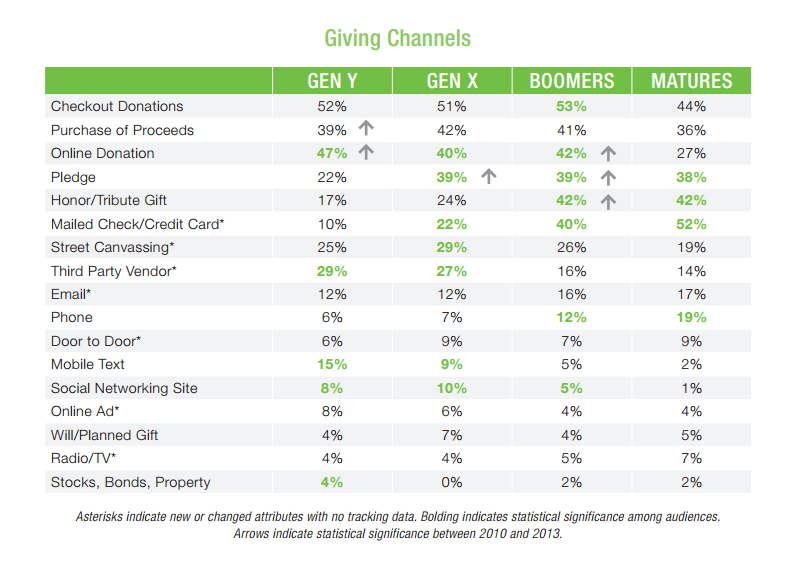
Among Generations X and Y, more donors report giving online than by snail mail over the past two years. As many Baby Boomers, the dominant giving generation, say they donated online (42 percent) compared to mail (40 percent). In comparison to 2010, when more Boomers were giving via the postal service, we can see the landscape is changing. Source
#32
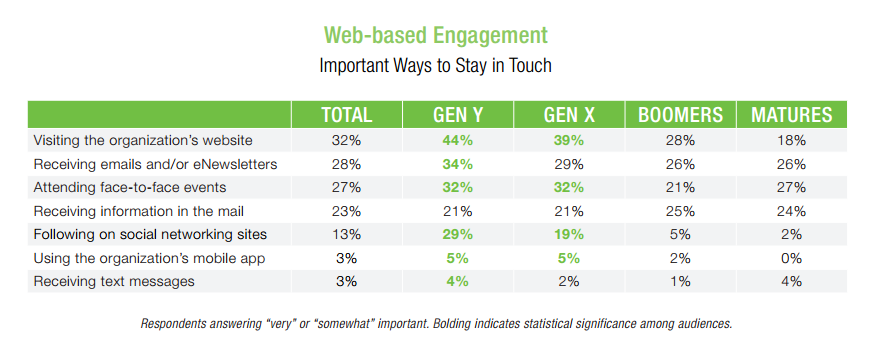
One-third of those surveyed said visiting an organization’s website is extremely or very important. Gen Y respondents were most likely to choose this ranking; 44 percent said as much, as did 39 percent of Gen X, 28 percent of Boomers, and 18 percent of Matures. Source
#33
Social media presents the most obvious intergenerational variations in donor interest. Nearly one-third of Gen Y (29 percent) said social media sites are extremely or very important ways to stay in touch, compared with two percent of Matures. Similarly, nearly 20 percent of Gen X said the same, but only five percent of Boomers concurred. Source
#34
Giving through social networks is low and has gone relatively unchanged since 2010. 6 percent of donors overall had given via Facebook, Twitter or other social mediums. Younger donors are only slightly more likely to have done so — 8t percent of Generation Y and 10 percent of Generation X stated they have donated through social networks iin the past two years. Source
#35
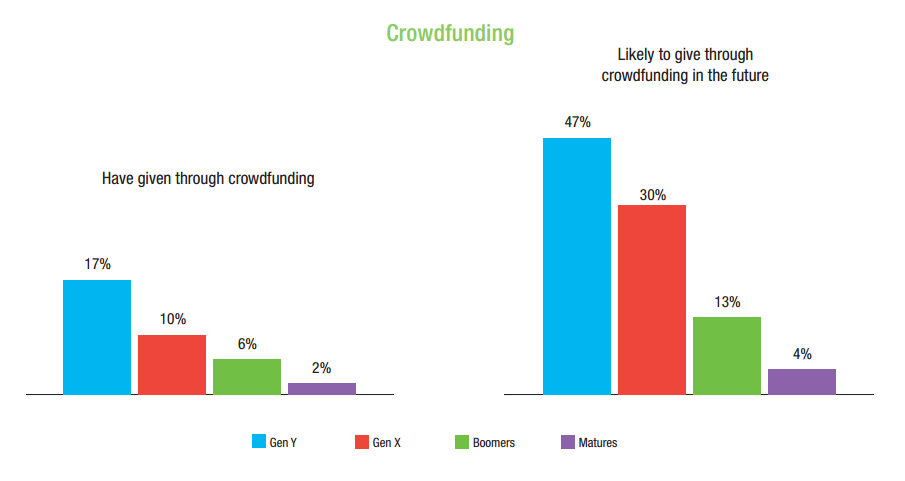
Specifically, 17 percent of Gen Y donors said they had given to a crowdfunding campaign in the past, and 47 percent say they would consider doing so again in the future. But, enthusiasm for the crowdfunding craze declines with age. Among Matures, only 2 percent said they have given in this manner and less than 5 percent said they would consider doing it again. Gen X appears persuadable, but Boomers might be a tough sell. Source
Promotion Strategies for Non Profit marketing (36 – 57)
#36
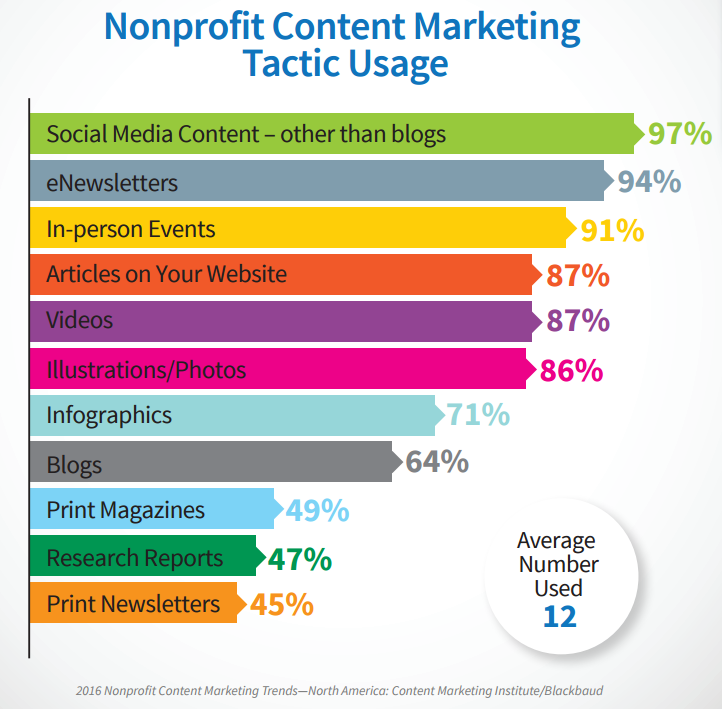
What content marketing tactics does your organization use? 97 percent use social media content to stir up the buzz. Source
#37
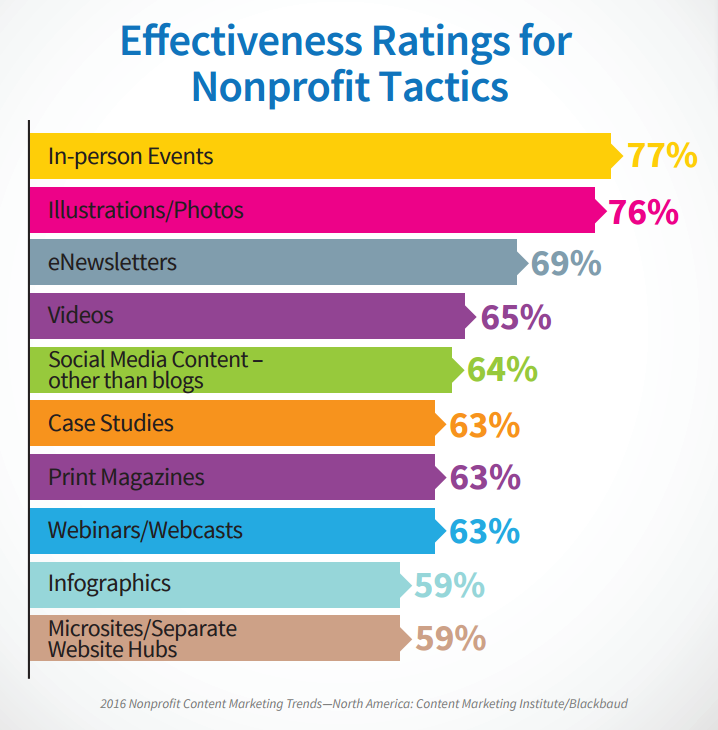
How effective are the tactics your organization is using? In-person events and illustrations as well as photos top the list. Source
#38
Based on 2015 plans, when it comes to direct mail, frequency still remains in question across the industry. 28 percent will send an email monthly, 26 percent will send one quarterly and 8 percent are merciless, sending one out every other week. Source
#39
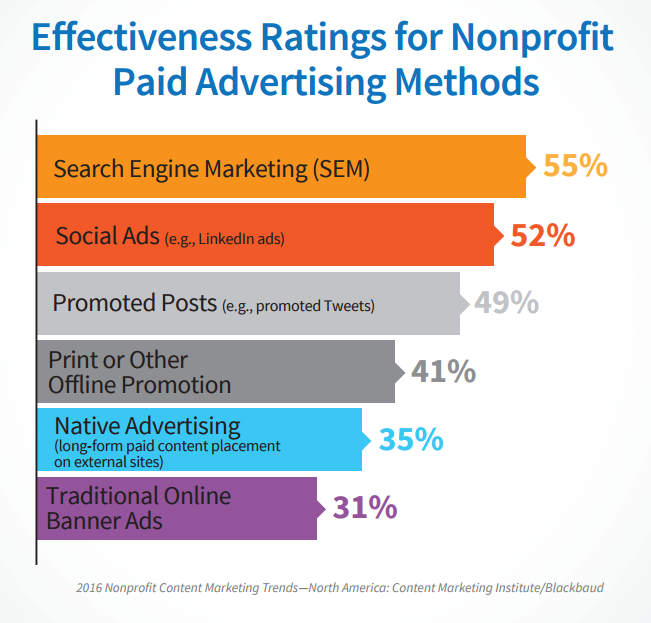
Just like in 2015, non-profit marketers claimed search engine marketing (SEM) is the most effective paid advertising method they’re using (56 percent last year vs. 55 percent this year). The effectiveness rating for social ads increased from 45 percent last year to an impressive 52 percent this year. Source
#40
E-Newsletters are still winning the popular contest, with 41 percent of non-profits sending them monthly and 23 percent sending them out quarterly. (90 percent are sending an e‐newsletter at some point during the year). Source
#41
More than one-third of organizations did not send a single email to new subscribers within the first 30 days of them signing up. Source
#42
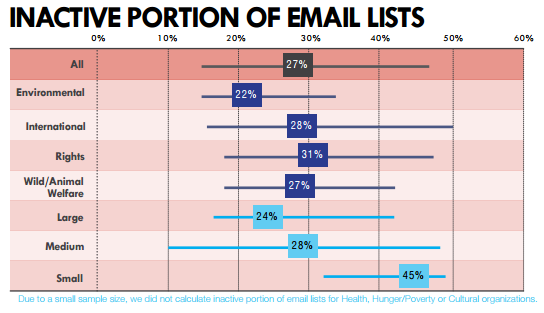
When we asked groups about their “inactive” segment, 47 percent responded that they suppress inactives in some way. Source
#43
#44
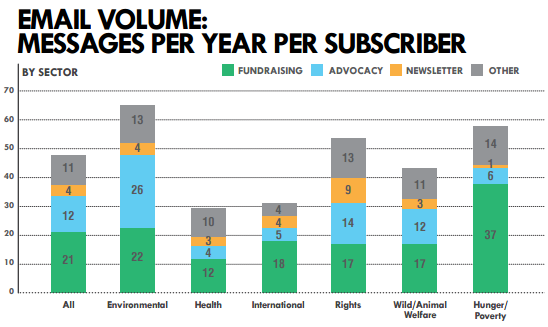
Domestic hunger and poverty groups were the most heavily weighted toward fundraising messaging, while environmental groups were the only sector to send more advocacy than fundraising messages in 2014. Source
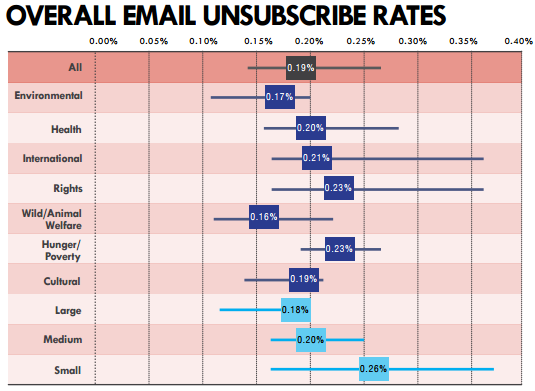
#45
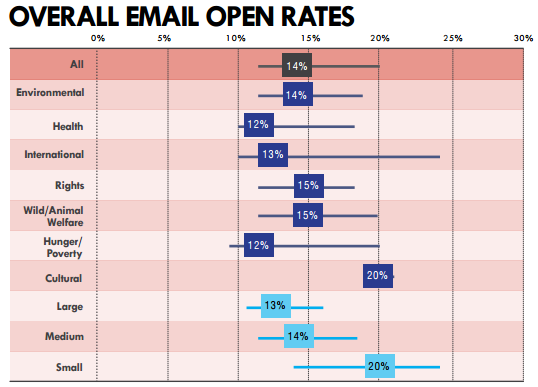
The overall average open rate in our study was 14 percent, but cultural groups enjoyed an average open rate of 20 percent for their messages. Source
#46
#47
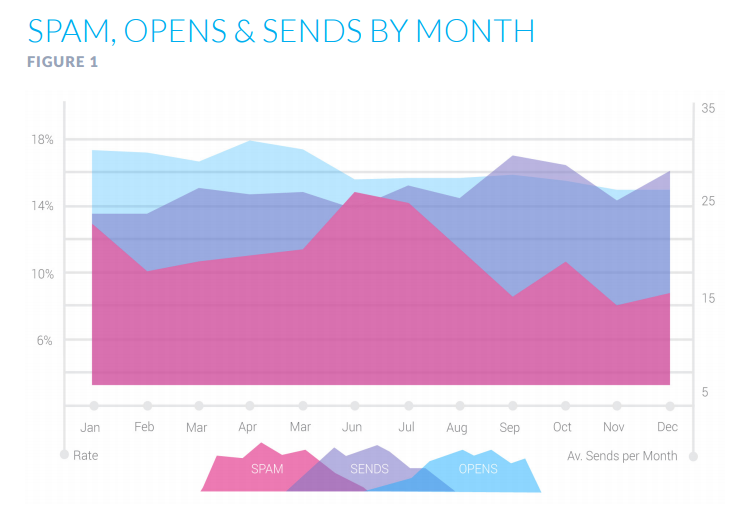
Non-profits could potentially increase email revenue by 14 percent for every percentage of their email that is heading directly to spam. Source
#48
In 2014, for the 55 organizations studied, #GivingTuesday saw an average of 11.63 percent of their fundraising messages going to spam. Source
#49
A non-profit loses an average of $14,795 every year due to spam. Source
#50
84 percent of non-profits haven’t made their sites mobile friendly. Source
#51
More than 8 out of 10 landing pages are NOT optimized for mobile. Source
#52
61 percent of non-profit professionals believed social media to be an effective content marketing tactic. Source
#53
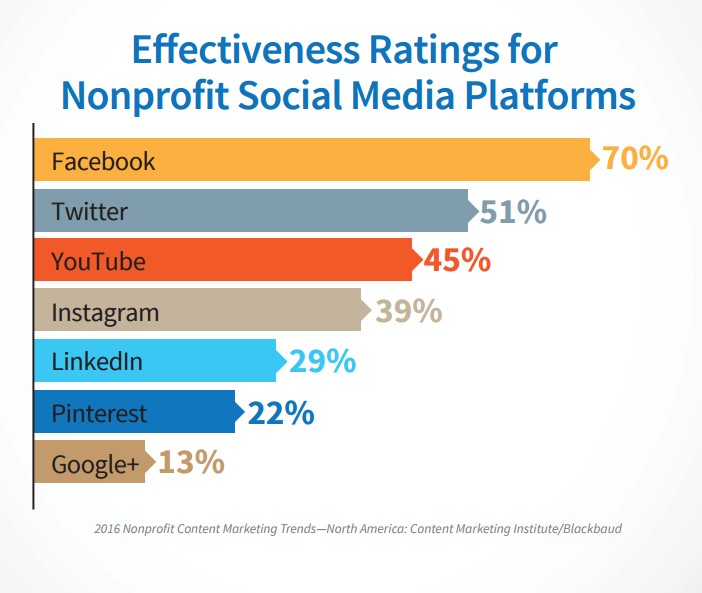
Facebook is rated as the most effective social media platform when it comes to the giving game. Source
#54
Audience growth on social media continues to be quite high. While email subscriber lists grew by 11 percent in 2014, Facebook and Twitter audiences grew by 42 percent and 37 percent respectively. Source
#55
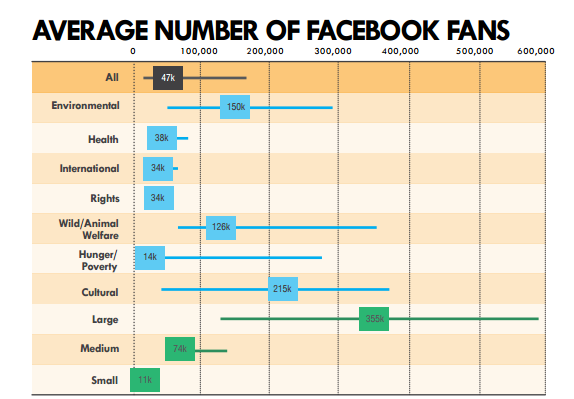
Audiences on social media continued to be significantly smaller than email list sizes. Facebook fans outpaced Twitter followers in every sector that had data for the two platforms. For every 1,000 email subscribers, study participants had 285 Facebook fans and 112 Twitter followers. Source
#56
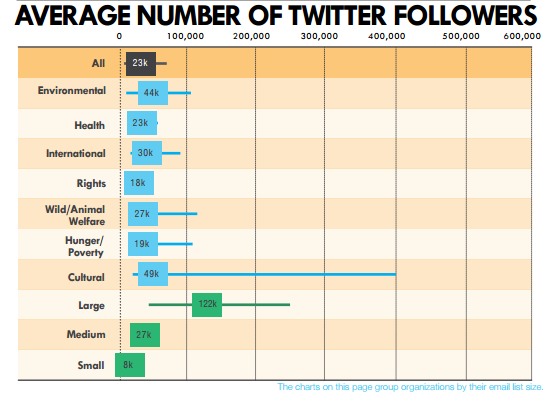
#57
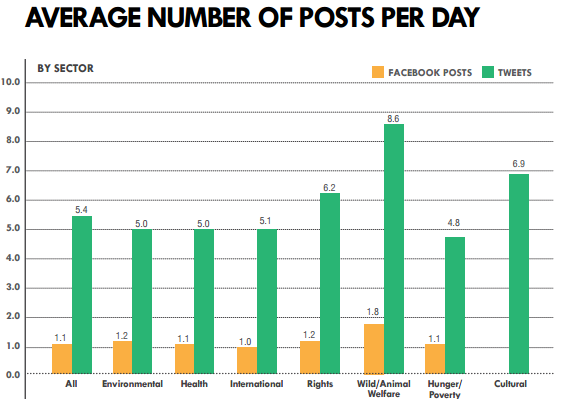
Post frequency saw some variation among sectors, with wildlife groups tweeting 8.6 times per day compared to the overall average of 5.4 times per day. And, posting to Facebook 1.8 times per day compared to the overall average of 1.1 posts per day. Source