40 Amazing Higher ED Marketing Stats for 2016
I’ve put together 40 amazing Higher Education Marketing stats from 2014 and 2015 since it’s so hard to find these stats online. I hope this helps you out, higher education marketers, enjoy!
These stats cover:
- How Students Choose a University or College
- Higher Education Marketing Strategies Being Used Today
- Web-Site Content
- Mobile Device Usage
- Social Media Device Usage
Contents
How Students Choose a University or College
#1
The plurality (39%) said “Level of debt…to pay for the degree” was their biggest concern of future students – up 4% from the 35% that chose that same answer in 2014. This was also the biggest concern among the plurality in 2013. For six years prior (2007- 2012), the biggest concern among the plurality (34%) was “If they get into their first choice college but won’t have sufficient funds or aid to attend.” In 2006, the biggest concern among the plurality (34%) was “I won’t get into first-choice college.” Source
#2
The plurality (45%) view the main benefit of a college degree as “a potentially better job and a higher income” (down 6% from the plurality of 51% that chose this answer in 2014). Thirty-one percent chose “exposure to new ideas” and 24% see “education” as the primary benefit. Source
Higher Education Marketing Strategies Being Used Today
#3
Sixty percent of marketing officials who responded to the survey said they created a brand strategy to increase awareness of their institution, while 38 percent reported that the goal was to meet enrollment benchmarks. Source
#4
Of those mentioned above, 63 percent spent more than $100,000 on their branding projects, including 31 percent that surpassed the $200,000 price tag. Source
#5
Supporting the idea that brand strategy initiatives are a newer trend for higher education, 61 percent of respondents said their brand work started within the past five years. Forty-two percent were motivated by increased competition and 38 percent said a directive from the president was the reason for pursuing a brand strategy initiative. Source
#6
More than half of those surveyed said they would measure the success of their strategy through growth in enrollment or fund-raising. But, about a quarter of respondents said they had no plan to formally measure whether the branding project was successful. Source
#7
The number of chief academic leaders reporting that online learning is critical to their long-term strategy has reached a new high of 70.8%. Source
#8
In 2014, of the 100 top Business Week higher education institutions, 43% are deploying their flagship .edu website using responsive web design. Source
Web-Site Content
#9
The most influential resources when researching colleges in 2015 were the College website: 77-80%, College planning site: 33 – 44% and Magazine rankings: 36%, Print: 33 – 38%. Source
#10
A website can make quite an impact on a student’s perception of an institution. In 2015
College websites power shifting perception of that institution: 77 – 78% (up from 70% in 2013), but some students 22 – 23% (down from 30% in 2013) say the website has no impact on their perception. Source, Source
#11
Stats show there was a preference for digital or print/phone for campus communications in 2015. Students are more likely to consider institutions that use email, text and social media to communicate: 55% – 60%, students are also more likely to consider institutions that use brochures and phone calls to communicate: 40 – 45%. Source
#12
The top content students were looking for on a college website in 2015 were: Academics (program listings, details, rankings): 38 – 43%, Money (cost, scholarships): 24 – 30%, Enrollment (application process, admissions events, counselor contacts): 19 – 21%, Life (residence, student, athletics): 6 – 10%, Wayfinding (location, directions): 3 -5%. Source
#13
Website content that best demonstrated the value of an education from university and colleges in 2015 were Job placement stats: 73 – 75%, Testimonials/quotes: 58 – 60%, Grad school placement stats: 45 – 50%, Program rankings: 45 – 46%, Program videos: 39%, Accreditation details: 23 – 29% and lastly,Faculty profiles: 22 -28%. Source
Mobile Device Usage
#14
Mobile device ownership continues to increase, 86% of undergraduates owned a smartphone in 2014 (up from 76% in 2013) and nearly half of students (47%) own a tablet (up from 31% in 2013). Source
#15
[tweetthis url=”https://www.myloudspeaker.ca/blog/40-amazing-higher-ed-marketing-stats-from-2014-2015/”]Most students owned either an iPhone (66 percent ) or an Android (30 percent ).[/tweetthis] Source
#16
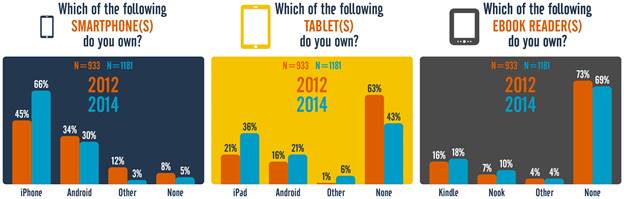
Overall smartphone ownership has increased only mildly (3 percent), but iPhone ownership increased substantially (20 percent), while Android ownership decreased (4 percent). Tablet ownership also increased (26 percent) with iPads accounting for the largest increase (15 percent) during that time. Source
#17
In 2015, more than half (56%) of teens — defined in this report as those aged 13 to 17 go online several times a day, and 12% report once-a-day use. Just 6% of teens report going online weekly, and 2% go online less often. Source
#18
Eighty-eight percent of American teens ages 13 to 17 have or have access to a mobile phone of some kind. And a majority of teens (73%) have smartphones. Smartphone users skew more toward older teens with 76% of 15- to 17-year-olds having a smartphone, compared with 68% of 13- to 14-year-olds. About a third of teens (30%) have a “basic” cell phone. About 15% of teens have both types of phones. Source
#19
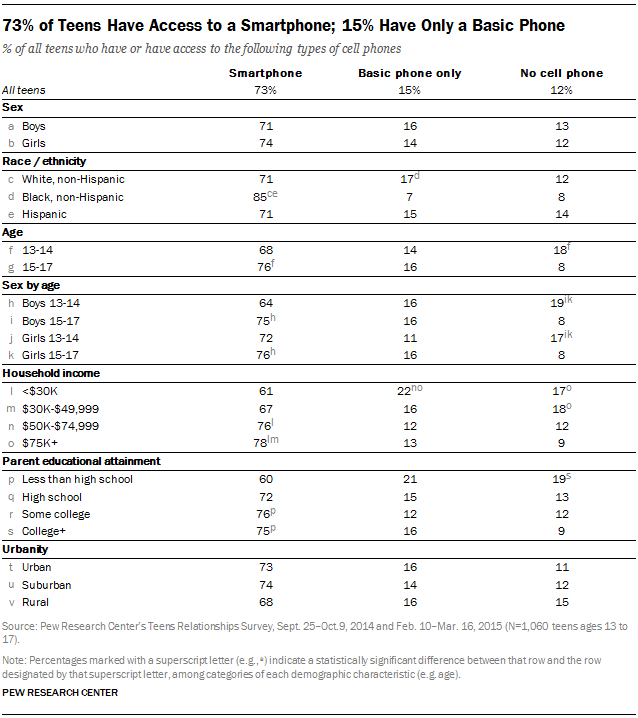
While 77% of teens whose families earn more than $50,000 a year own a smartphone, two-thirds (64%) of teens from families earning less than that own one. Those teens with lower incomes are the most likely to have a basic cell phone — with 39% of teens from households earning less than $30,000 annually reporting basic cell ownership compared with 28% of teens from households earning more. Source
#20
Seventy percent of students have looked at a college website on a mobile device (up from 68 percent in 2013). Source
#21
Forty-three percent of students reported using their mobile devices for all of their web browsing. Source
Social Media Device Usage
#22
There were 1.04 billion daily active users on Facebook on average in December 2015. Source
#23
Facebook saw older teens (13 – 17) drop: 2013: 88%, 2014: 94%. Source
#24
Facebook’s Social Advertising platform shows 3 million fewer addressable 13-17 year olds today (2014) compared to 2011. Source
#25
In 2014, the number of Active Facebook Users of 13-17 year olds was 9.8 Million. Source
#26
Facebook remains the most used social media site among American teens aged 13 to 17 making up 71 percent of all teens using the site, even as half of teens use Instagram and four out of ten use Snapchat. Source
#27
A majority of teens — 71% — report using more than one social network site out of seven platform options they were asked to choose from. Among the 22% of teens who only use one site, 66% use Facebook, 13% use Google+, 13% use Instagram and 3% use Snapchat. Source
#28
Boys are more likely than girls to report that they visit Facebook most often (45% of boys vs. 36% of girls). Girls are more likely than boys to say they use Instagram (23% of girls vs. 17% of boys) and Tumblr (6% of girls compared with less than 1% of boys). Source
#29
Older teens aged 15 to 17, are more likely than younger teens to cite Facebook (44% vs. 35% of younger teens), Snapchat (13% vs. 8%) and Twitter (8% vs. 3%) as their most often used platform, while younger teens ages 13 to 14 are more likely than their older compatriots to list Instagram (25% vs. 17% of older teens) as a platform they visit most often. Source
#30
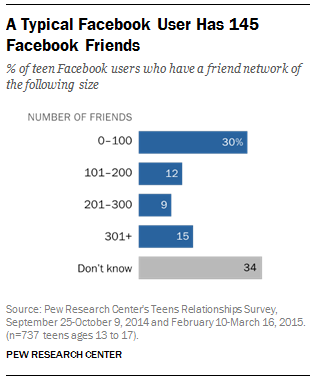
Breaking it down, the largest group of teens — 30% — say they have Facebook networks of 0 to 100 friends. Another 12% report networks of 101-200 friends and 9% say 201 to 300 friends. And 15% say they have more than 300 friends. Source
#31
The Instagram community has grown to more than 400 million strong in 2015. Source
#32
19.1% of U.S. Instagram users were under 17 years old as of January 2015. Source
#33
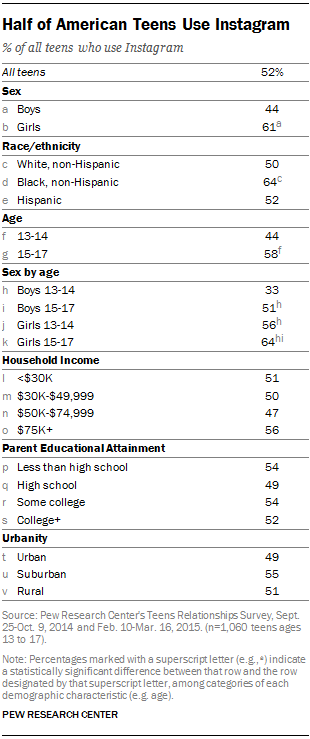
More than half (52%) of all teens report using Instagram to share photos and video with friends, with girls substantially more likely to use it than boys (61% to 44%). Source
#34
The typical American teen on Instagram has 150 followers on their network. Girls outpace boys in their typical number of followers, with girls reporting a median of 200 followers on Instagram compared with 100 followers for boys. Source
#35
In May 2014, Snapchat reported 700 million photos sent per day on the app, with 500 million Snapchat Stories. Source
#36
In the first quarter of 2015, the Snapchat penetration rate among U.S. teen internet users, 16 to 19 years old, was 38 percent. Source
#37
Forty-seven percent of older teens 15 to 17 send snaps, while 31 percent of younger teens do so. Older girls are the most likely than any teen group to use the service, with 56% using Snapchat. Source
#38
As of the fourth quarter of 2015, the microblogging service averaged at 305 million monthly active users. At the beginning of the 2015, Twitter had surpassed 302 MAU per quarter. Source
#39
Older teens are more likely to use the service than younger, with use rising steadily as teens age, from just 13 percent of 13-year-olds using the service to 28 percent of 14-year-olds and 43 percent of 17-year-olds. The oldest girls ages 15 to 17 are the most likely to use Twitter with nearly half of them (49%) using it. Source
#40
Among teens who use Twitter, the typical Twitter user has 95 followers. Source
If you want to learn more about the Marketing of Higher Education, it might be valuable to read our Higher Education Marketing Strategies & Tips