How-to Slay Social Media Analysis, A Look at 2015-2016
How do you monitor and analyze your Social Media Campaigns? You probably check in on your posts’ reach or clicks, likes, retweets, shares or new followers. And sure, those are good indicators to evaluate your social campaigns…
However, are those posts valuable to your website or blog? When you think about it, do your posts on social media really drive valuable traffic, such as new and non-bounce users to your website? Did those users take the actions you intended them to?
If you use your social media to bring new users to your website, you should know how many of those new and non-bounce users came to your website through that channel. As a heads up, clicks on your social media might be from the same people, and it doesn’t guarantee they’ll be exploring your website. So, how can you know what it is you need to know?
The answer is Google Analytics. With this trusty tool in your back pocket, you can even see what time and which day of the week you should be posting on social media to acquire more traffic from your chosen social media platform. Even I, an SEO specialist, am well aware of the importance of timing a post on social media.
As we all know, each business has a different demographic. Even within same industry, there are subtle differences. With updates on stats from a Social Media guru, you can still better your chances of getting the clicks and actions from your users.
I’ll be giving you the rundown on the following:
1) The profiles of users from LinkedIn, Facebook and Twitter (Fun fact: Twitter brings the most un-bounce users)
2) Which days of the week, hour of day and day of month users come visit websites & blogs divided by Twitter, LinkedIn and Facebook on
3) How you can do the same for your Social Media – DIY!
In order for you to do “DIY”, you’ll need:
1) Google Analytics of the past 6 months (preferably one year)
2) Microsoft Excel (and a bit of Excel know-how).
Contents
Here is the analysis for My Loud Speaker’s Social Media from 2015 – 2016
Here, I’ll go over my finding through My Loud Speaker’s social media research. As I said before, the data that I am going to show here is just from our social media and could not yours. I strongly recommend you give it a try with your analytics. Are you excited? I’m excited.
I’ve divided Sessions, New Users and Non-bounce sessions by a day of the week, an hour of the day and a day of the month for each social media platform – Twitter, LinkedIn and Facebook
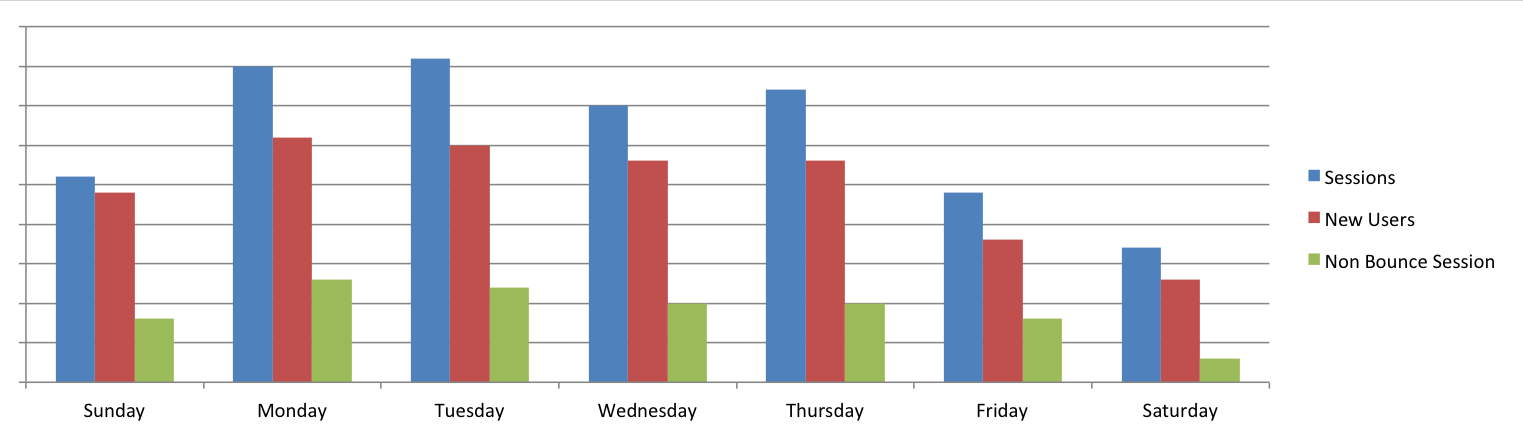
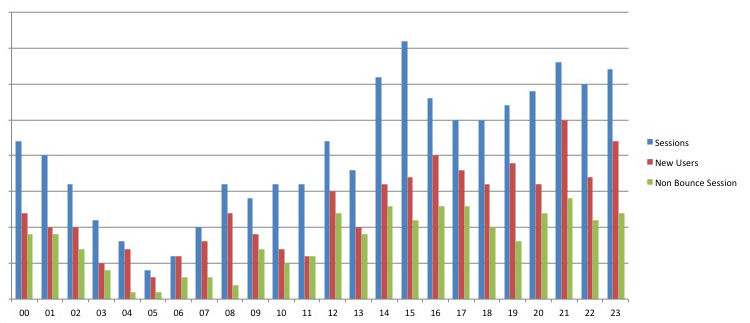
1) Good Days of the Week to post on Twitter
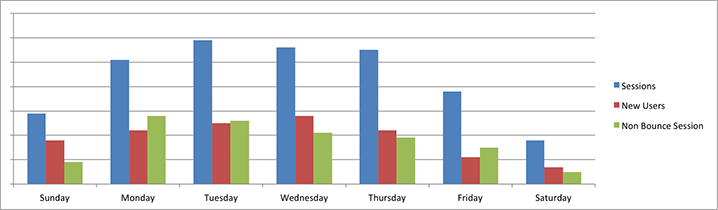
i. Sessions: 1) Tuesday 2) Wednesday 3) Thursday 4) Monday
ii. New Users: 1) Wednesday 2) Tuesday 3) Monday & Thursday
iii. Non-bounce: 1) Monday 2) Tuesday 3) Wednesday 4) Thursday
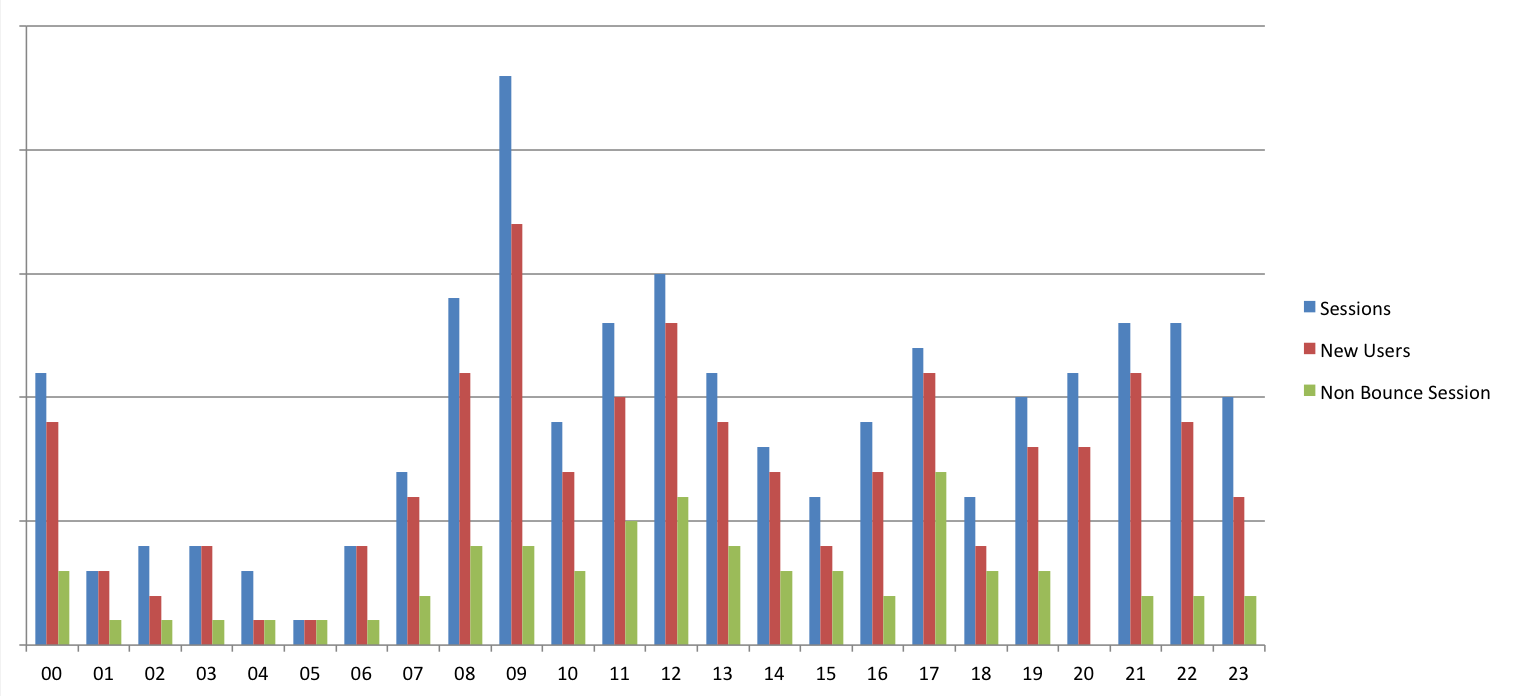
2) Good hours of the Day to post on Twitter
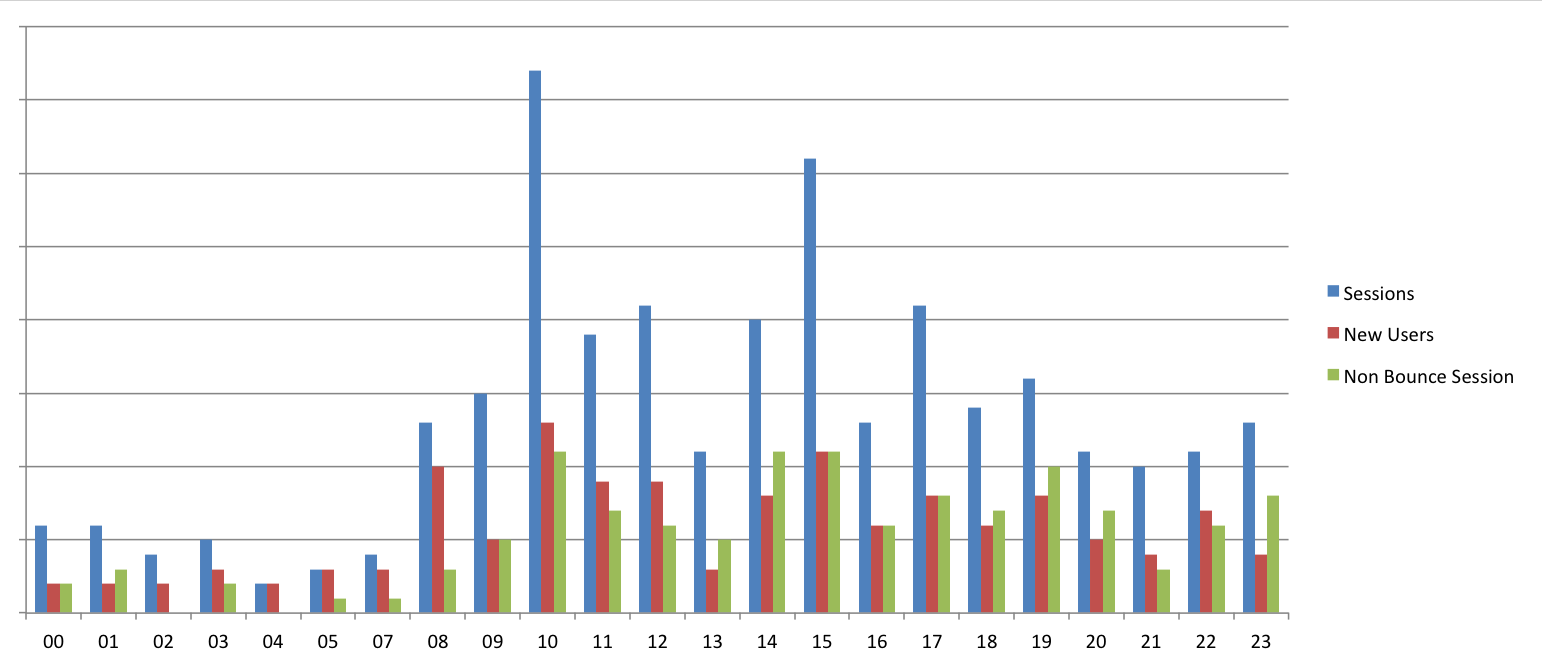
i. Sessions: 10am, 3pm
ii. New Users: 10am, 3pm
iii. Non-bounce: 10am, 2pm, 3pm
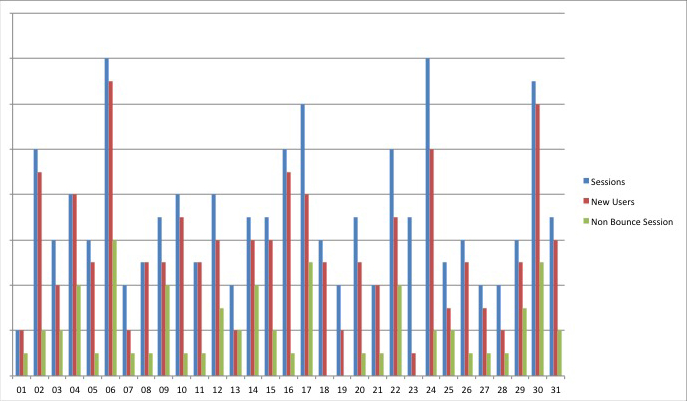
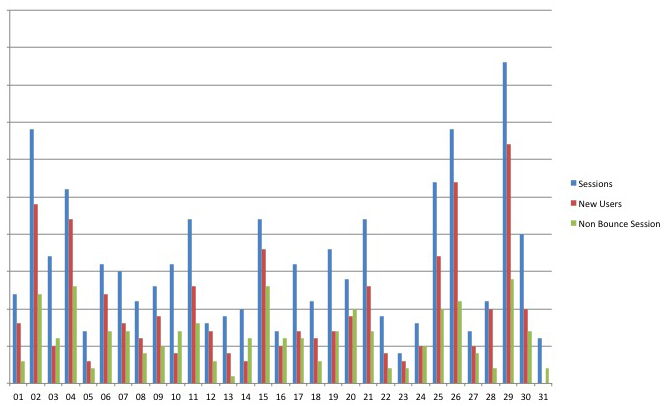
3) Good Days of the Month to post on Twitter
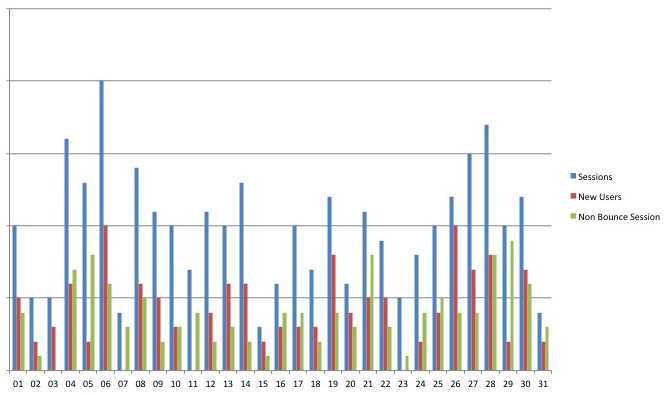
i. Sessions: 6th, 28th, 4th
ii. New Users: 6th & 26th,
iii. Non-bounce: 29th, 5th & 21th & 28th
4) Findings & Thoughts
Overall, the ratio of new users was not as high as I thought it would be on our Twitter platform, which is where we’re supposed to acquire more new visitors generally. As for day of the week, we generated the most sessions on Tuesday, new sessions on Wednesday, and Non-bounce sessions on Monday. Which leads me to believe, we should post on Monday and Thursday – more specifically, engagement posts on Monday, viral and catchy posts we’ll save for Wednesday. In terms of hour of the day, it seems it doesn’t have any consistency but 10am and 3pm look to be the most active. Finally, for day of the month to acquire sessions, new users and Non-bounce sessions from Twitter, the beginning and the end of month are a good time to pounce – I can assume that people and businesses are more focused on their own execution in the middle of the month.
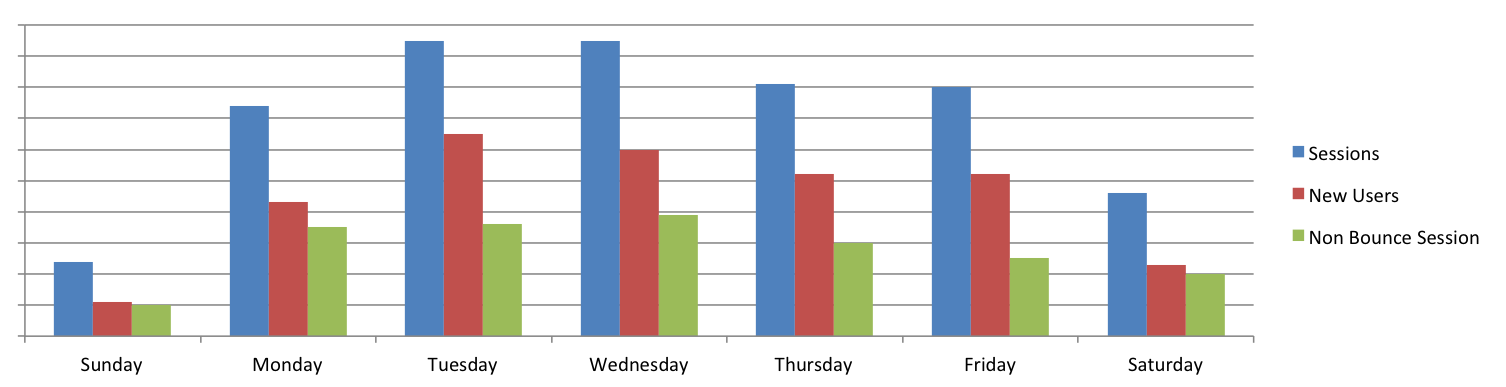
1) Good Days of the Week to post on LinkedIn
i. Sessions: 1) Tuesday, 2) Monday, 3) Thursday, 4) Wednesday
ii. New Users: 1) Monday, 2) Tuesday, 3) Wednesday & Thursday
iii. Non-bounce: 1) Monday, 2) Tuesday, 3) Wednesday & Thursday
2) Good hours of the Day to post on LinkedIn
i. Sessions: 9am, 12pm
ii. New Users: 9am, 12pm
iii. Non-bounce: 5pm, 12pm
3) Good Days of the Month to post on LinkedIn
i. Sessions: 6th & 24th, 30th
ii. New Users: 6th, 30th, 24th
iii. Non-bounce: 6th, 17th & 30th
4) LinkedIn Finding & Thoughts
Overall, LinkedIn is relatively more likely to bring new users, but they show a high bounce rate. Just so you know, our agency hasn’t focused on LinkedIn as much as we have with Facebook and Twitter, and that could be the reason behind the higher rate of new users. As for day of week, new sessions, Non-bounce sessions and sessions (pretty much) are gradually going down from Monday to Friday – it seems like users are eager to work on Monday. For that reason, we should put any promotions on LinkedIn towards the beginning of week. In terms of hour of day, we can generate sessions, new users and Non-bounce sessions at 9am, 12pm and 5pm, and we see more consistency than Twitter. I assume that most LinkedIn users check updates of who they follow on LinkedIn before start they working, during lunch time and before going home. Finally, for day of month, the trend is mostly similar to one on Twitter, but sessions and new users get up once in the middle of the month.
1) Good Days of the Week to post on Facebook
i. Sessions: 1) Tuesday & Wednesday, 3) Thursday, 4) Friday
ii. New Sessions: 1) Tuesday, 2) Wednesday, 3) Thursday & Friday
iii. Non-bounce: 1) Wednesday, 2) Tuesday, 3) Monday, 4) Thursday
2) Good hours of the Day to post on Facebook
i. Sessions: 3pm, 9pm,
ii. New Sessions: 9pm, 11pm
iii. Non-bounce: 9pm, 4pm, 5pm
3) Good Days of the Month to post on Facebook
i. Sessions: 29th, 2nd & 26th
ii. New Sessions: 29th, 26th, 2nd
iii. Non-bounce: 29th, 15th & 4th
4) Finding & Thoughts
Overall, Facebook is smack dab in the middle of Twitter and LinkedIn. As for day of the week, Tuesday and Wednesday are the best days to post; and sessions, new users and sessions keep steady through Friday unlike on Twitter and LinkedIn. In terms of hour of the day, interestingly the sessions, new users and Non-bounce users increase from noon to 11pm – I assume that users on Facebook are more likely to use it in their private time. Finally, the time of the month is almost the same as Twitter. They are busy enough not to check updates on their Facebook.
Now, I have gone over the things that I found through my analytics, and again this data may not apply to your business. From here on, I’ll go over how to do it yourself. Don’t worry, while it’s a bit complicated – it can be replicated by your business to reinforce your social media campaigns.
Ok then, now time for a DIY – how you are going to do this
Before jumping into this, remember that you’ll need these two things:
1) Google Analytics for the past 6 months (preferably one year)
2) Microsoft Excel (and a bit of excel know-how)
Got it? Then let’s dive in, friends!
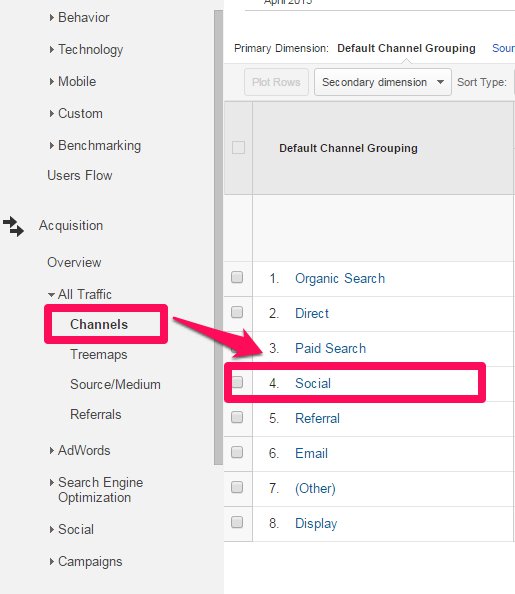
1. Go to your Google Analytics and “Channel” -> “Social”
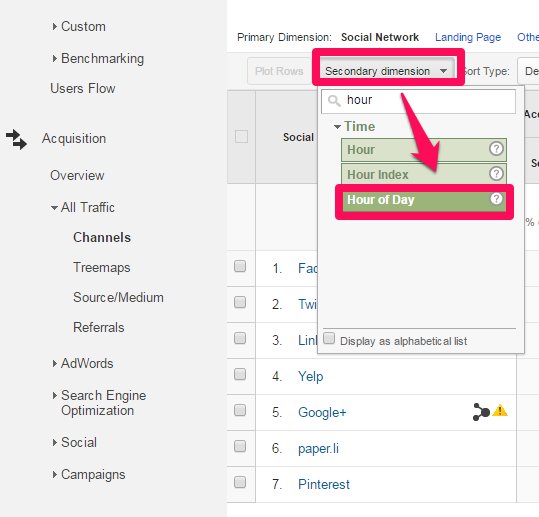
2. “Secondary dimension” -> “Hour of Day”, and confirm that every hour of day for sessions that show up
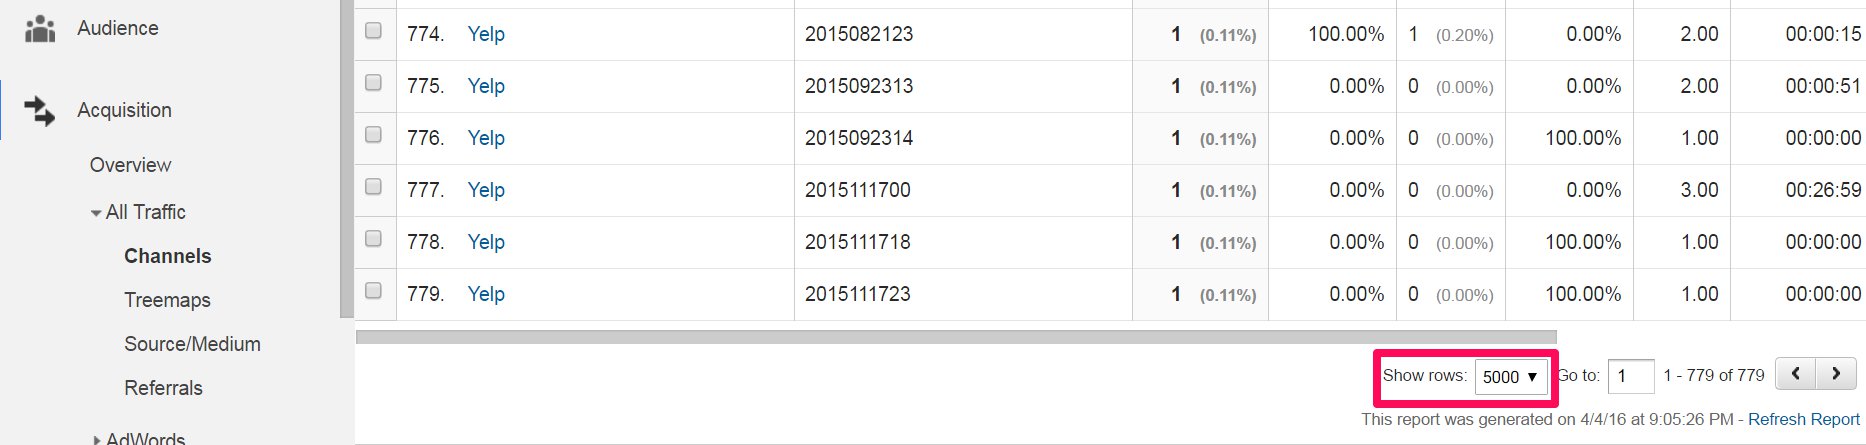
3. Show rows:”5,000”
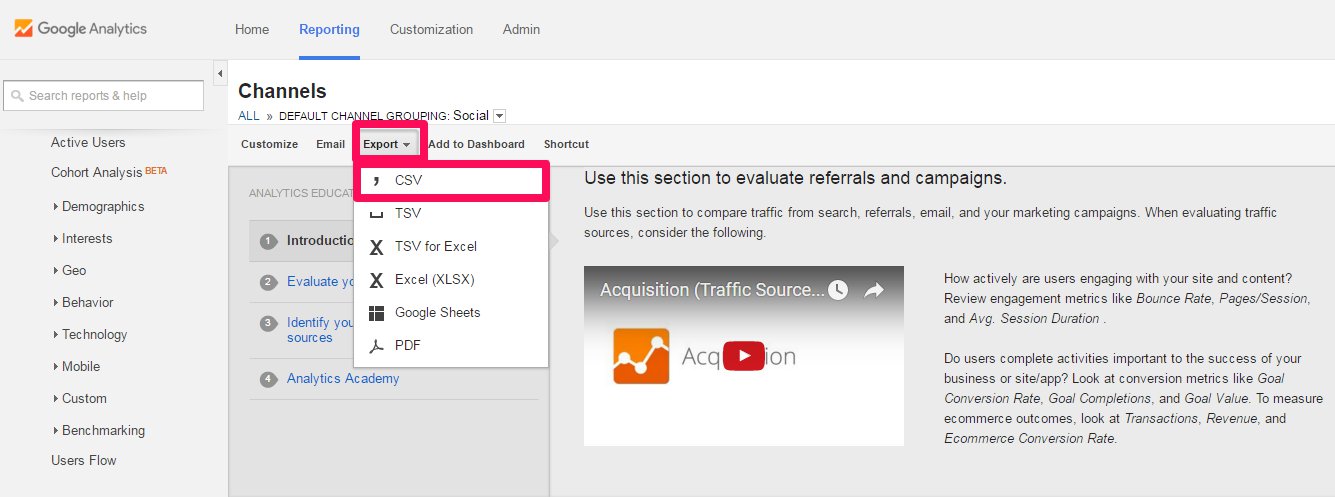
4. Export -> CSV
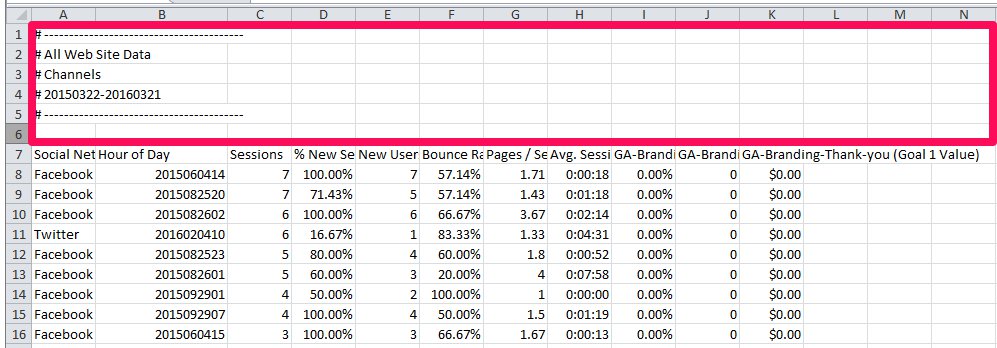
5. Go to CSV File -> Save as “.xlsx” -> Delete Line 1 to 6
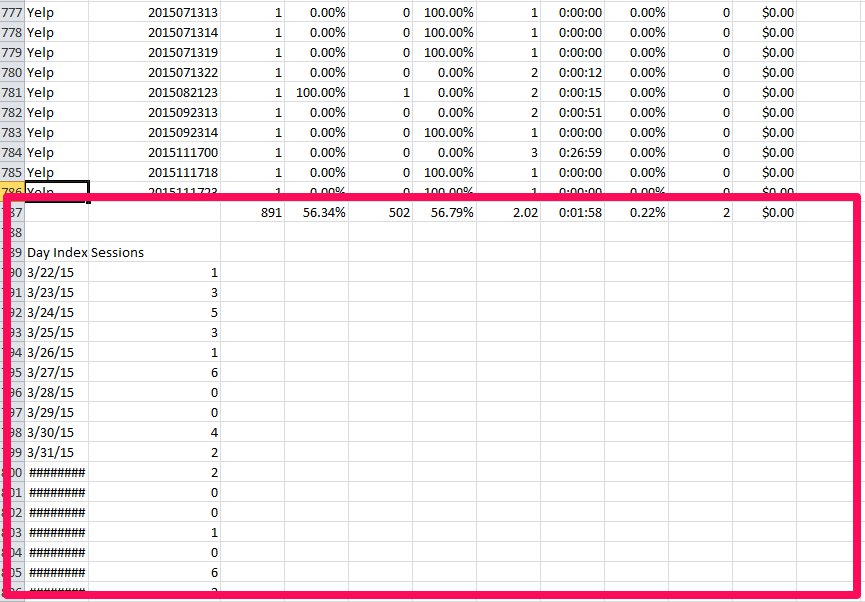
6. Delete Line under Day Index as well as sum (line 787 on this cell)
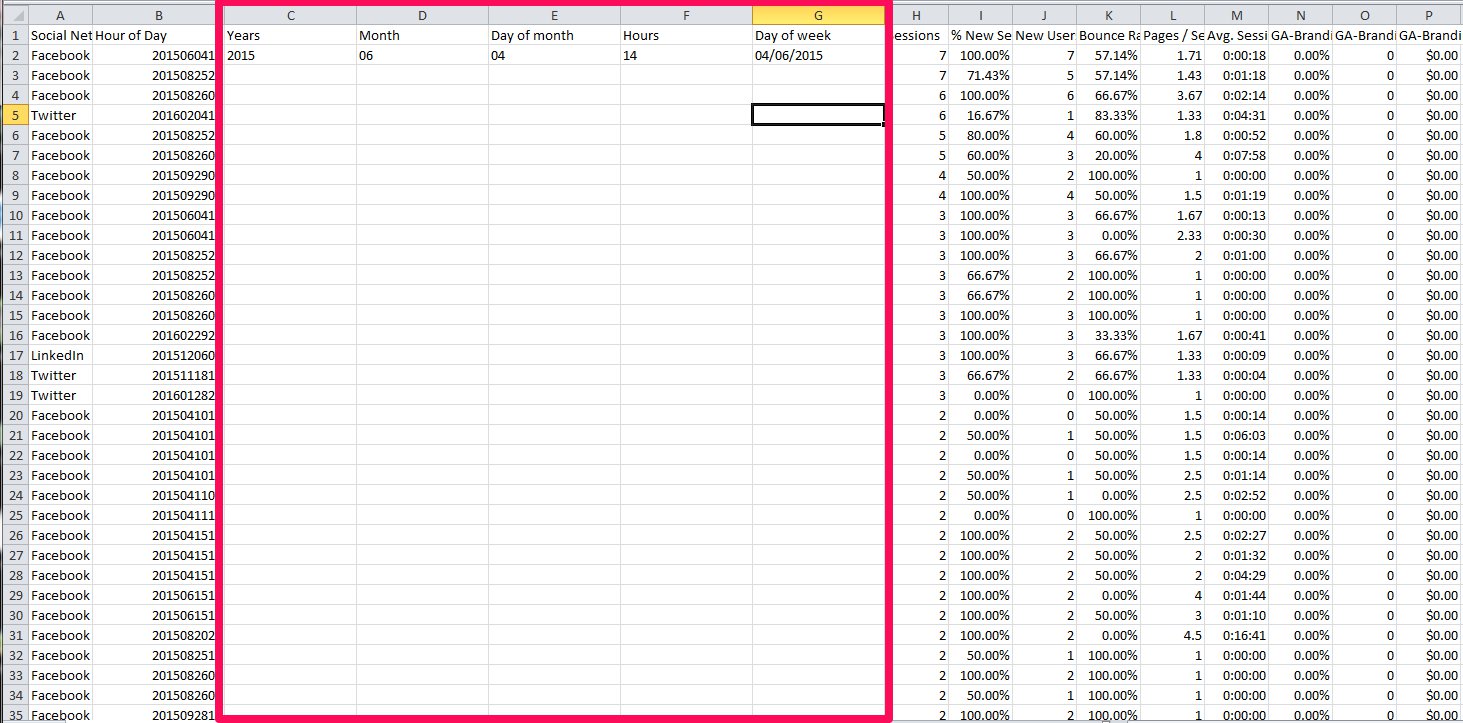
7. Add Column C to G, and put the values and formulas below:
C1: Years , C2: “=LEFT(B2,4)”
D1: Month, D2: “=MID(B2,5,2)”
E1: Day of month, E2: “=MID(B2,7,2)”
F1: Hours, F2: “=RIGHT(B2,2)”
G1: Day of week, G2: “=E2&”/”&D2&”/”&C2”
8. Copy and Paste the same formula to the end of the line
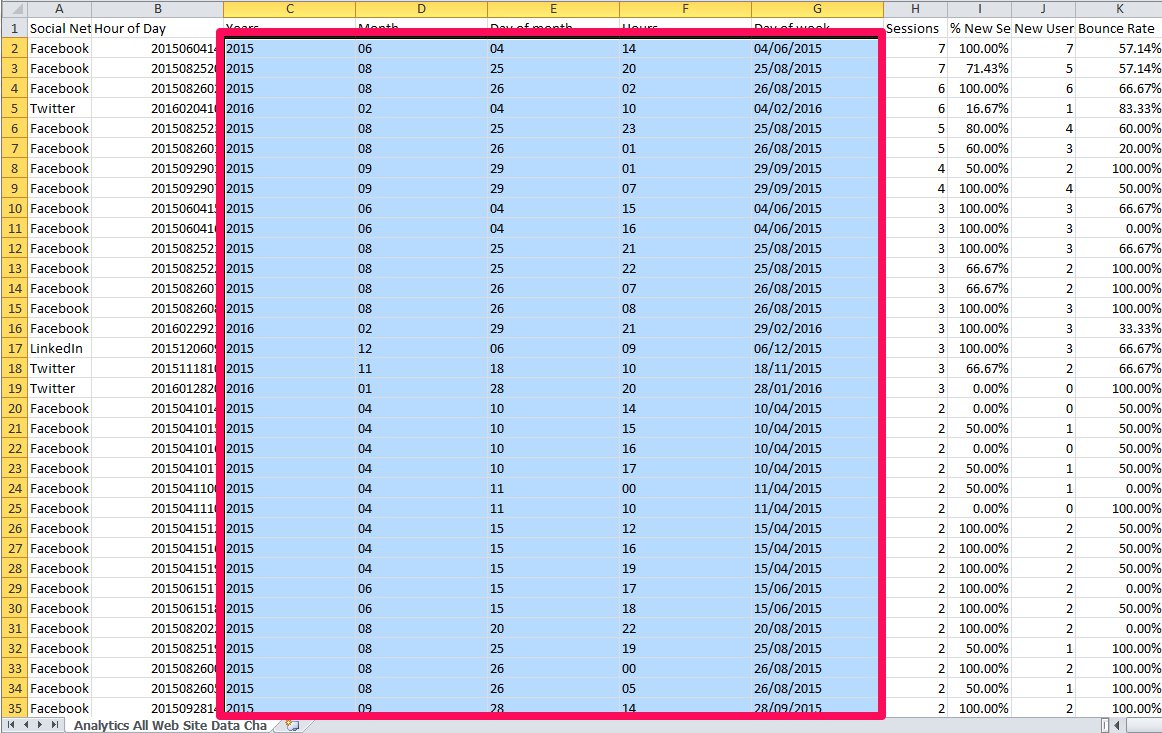
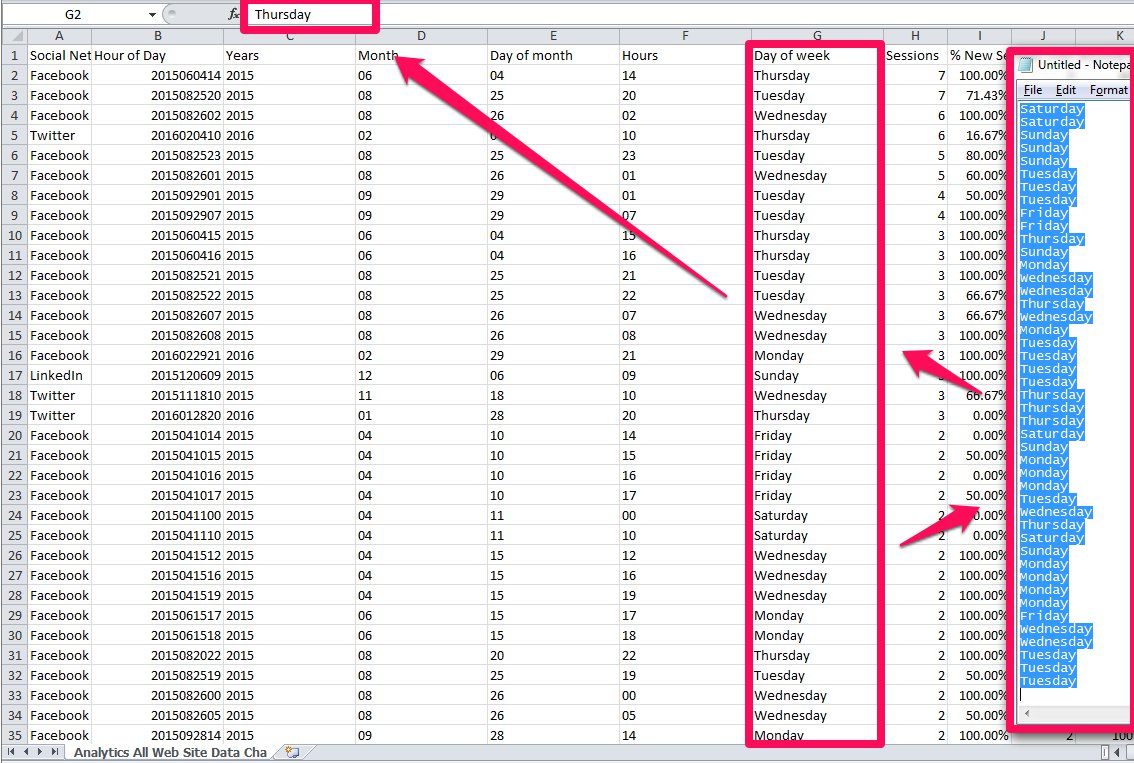
9. Copy all Column G -> Paste it on any notepad tool -> Re-paste it on Column G, confirm that the value in the window is a date like “04/06/2015” instead of formula like “=E2&”/”&D2&”/”&C2”
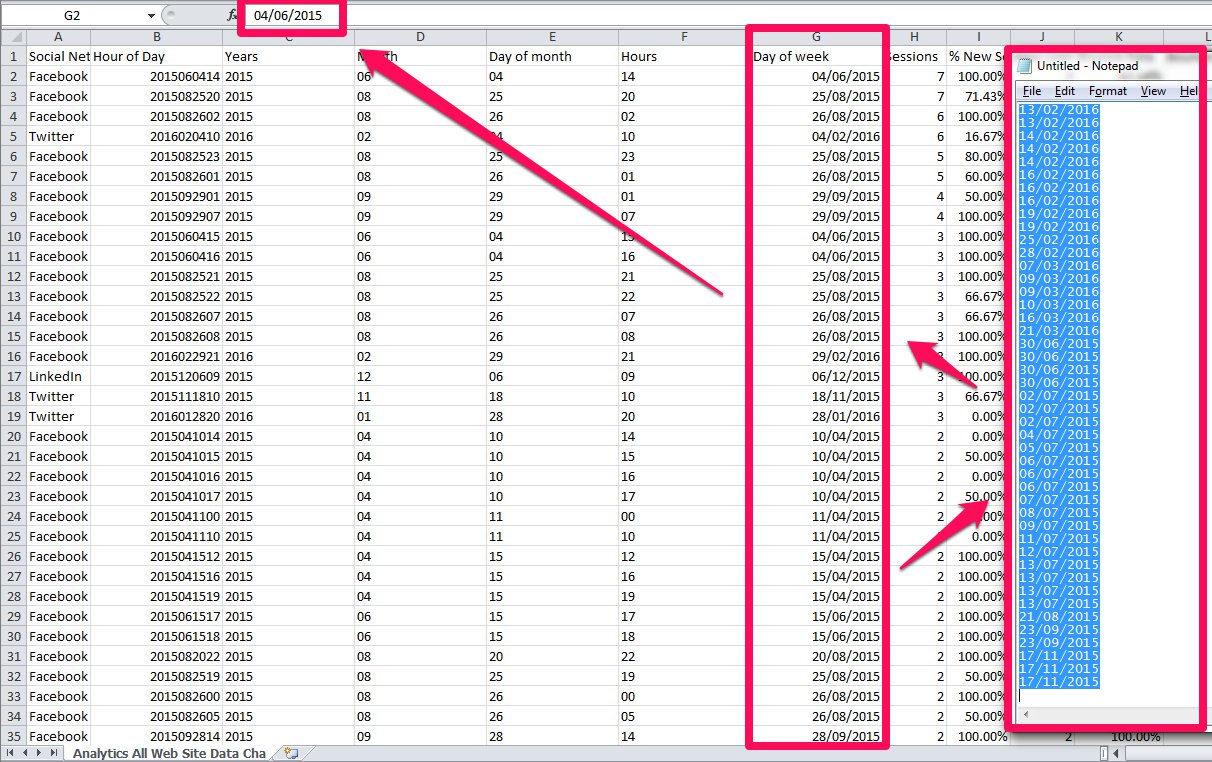
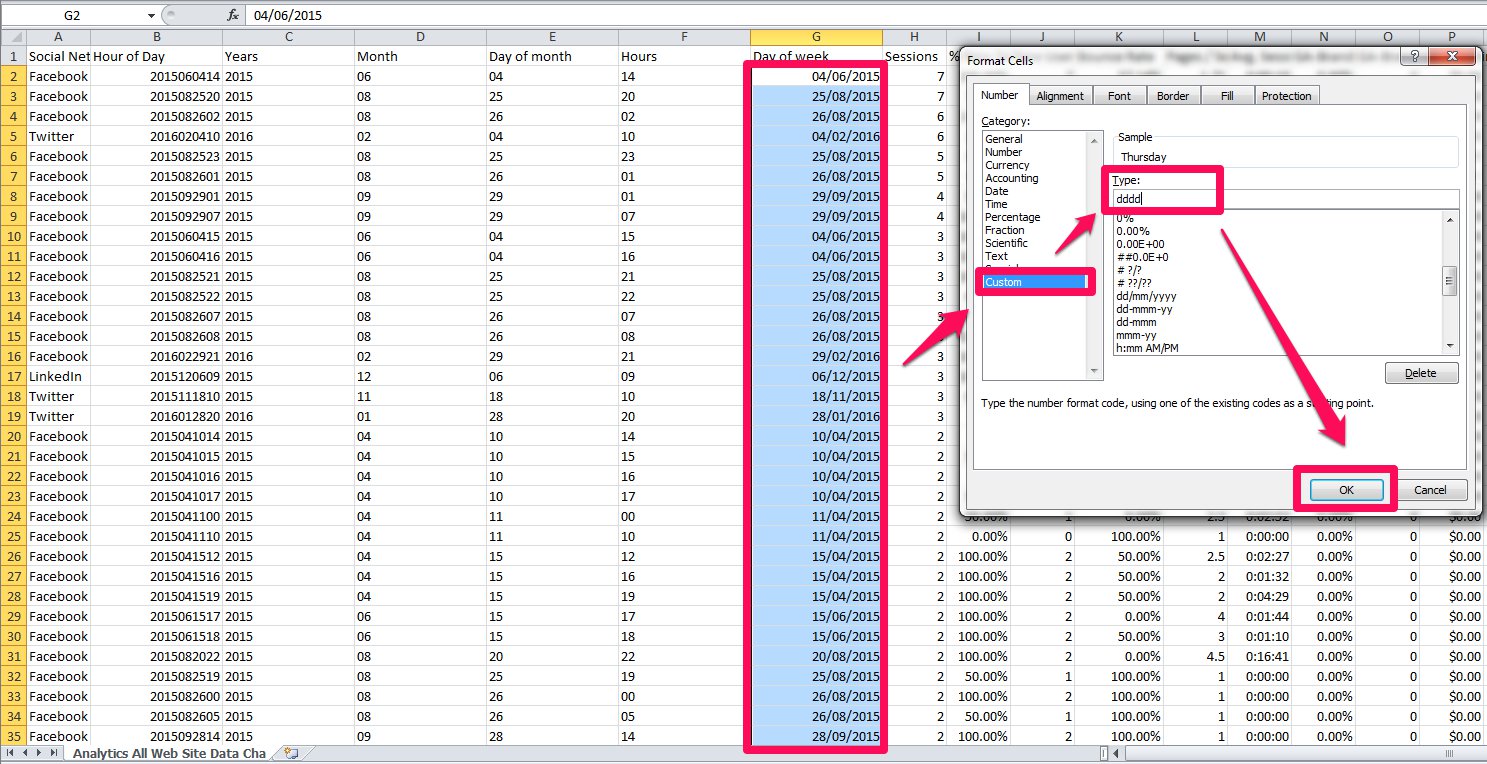
10. Keep choosing cells on G column, right click -> “Format Cells” -> “Number” Tab -> Go to Custom and Change Type of “dd/mm/yyyy” to “dddd”
11. Copy all Column G -> Paste it on Notepad -> Re-paste it on Column G, confirm that the value in the window is a day of the Week like “Thursday” instead of a day like “04/06/2015”
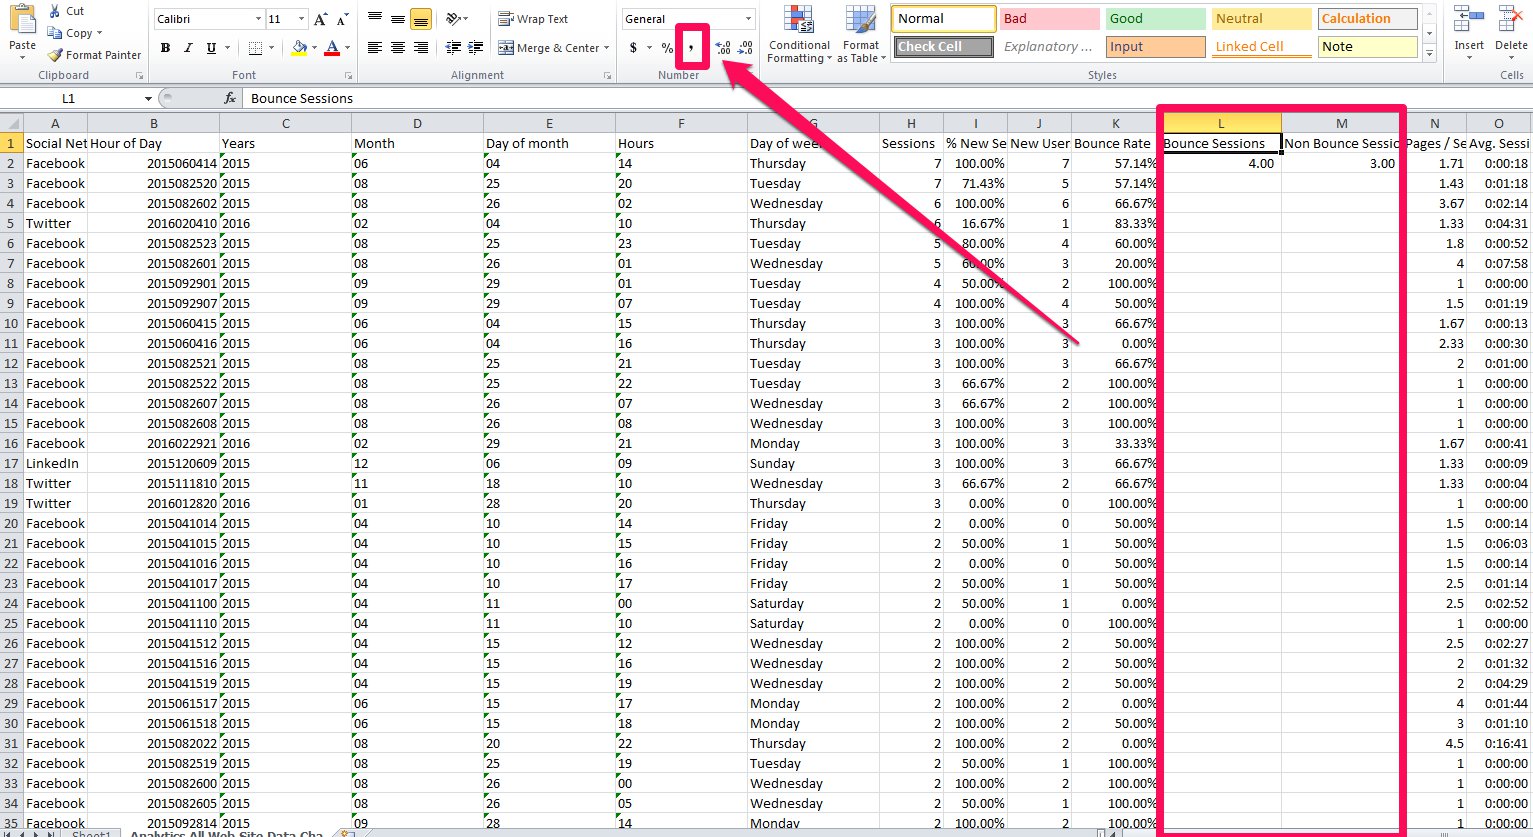
12. Add L & M columns in between “Bounce Rate” and “Pages / Session” -> add value and formula (L1: Bounce Sessions, L2: “=H2*K2″, M1: Non-bounce Sessions, M2:”=H2-L2”) -> Push Comma Style -> copy and paste
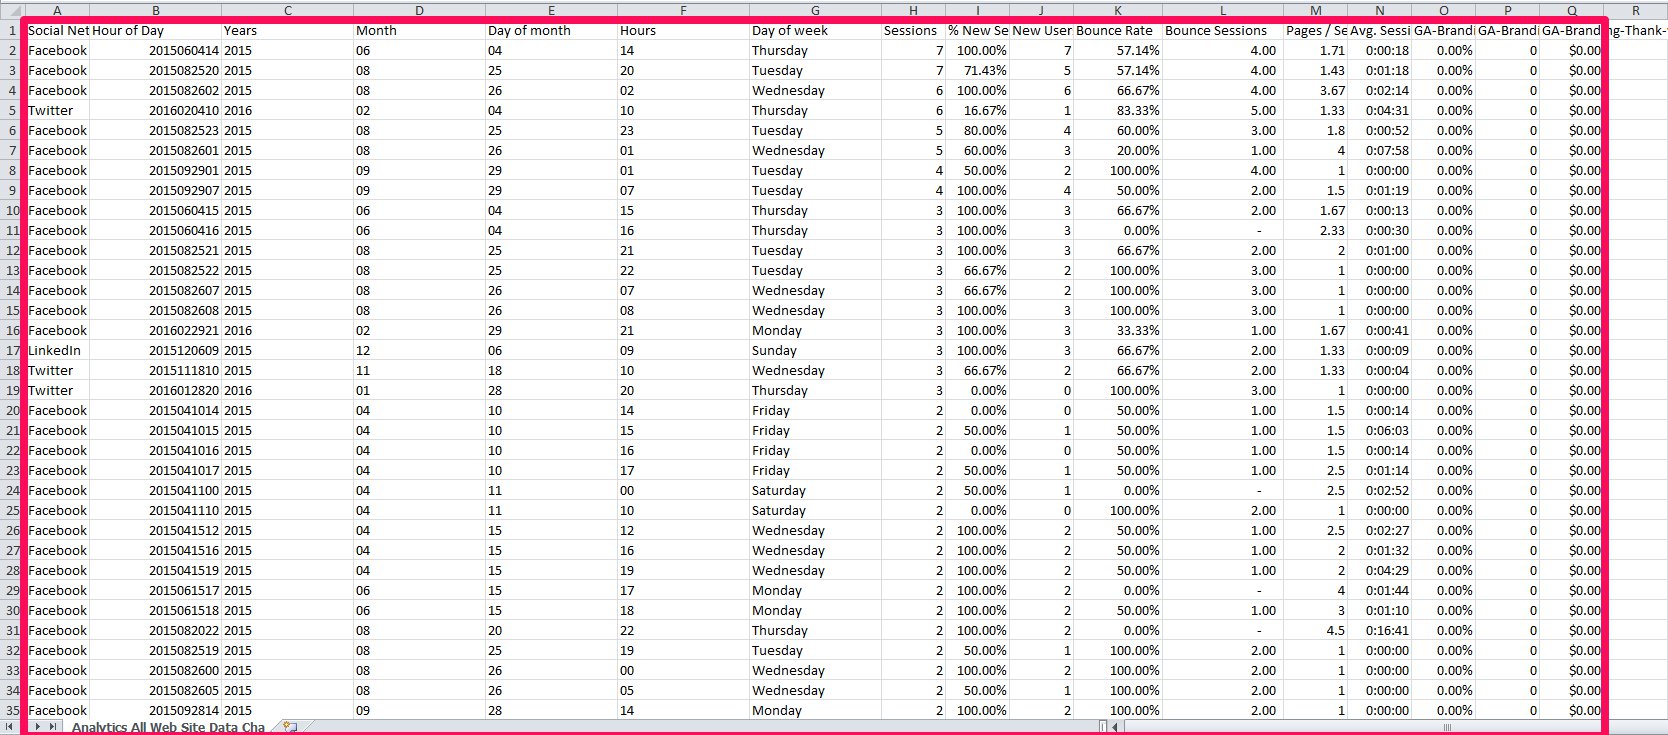
13. Choose all cell -> Paste Special -> Value
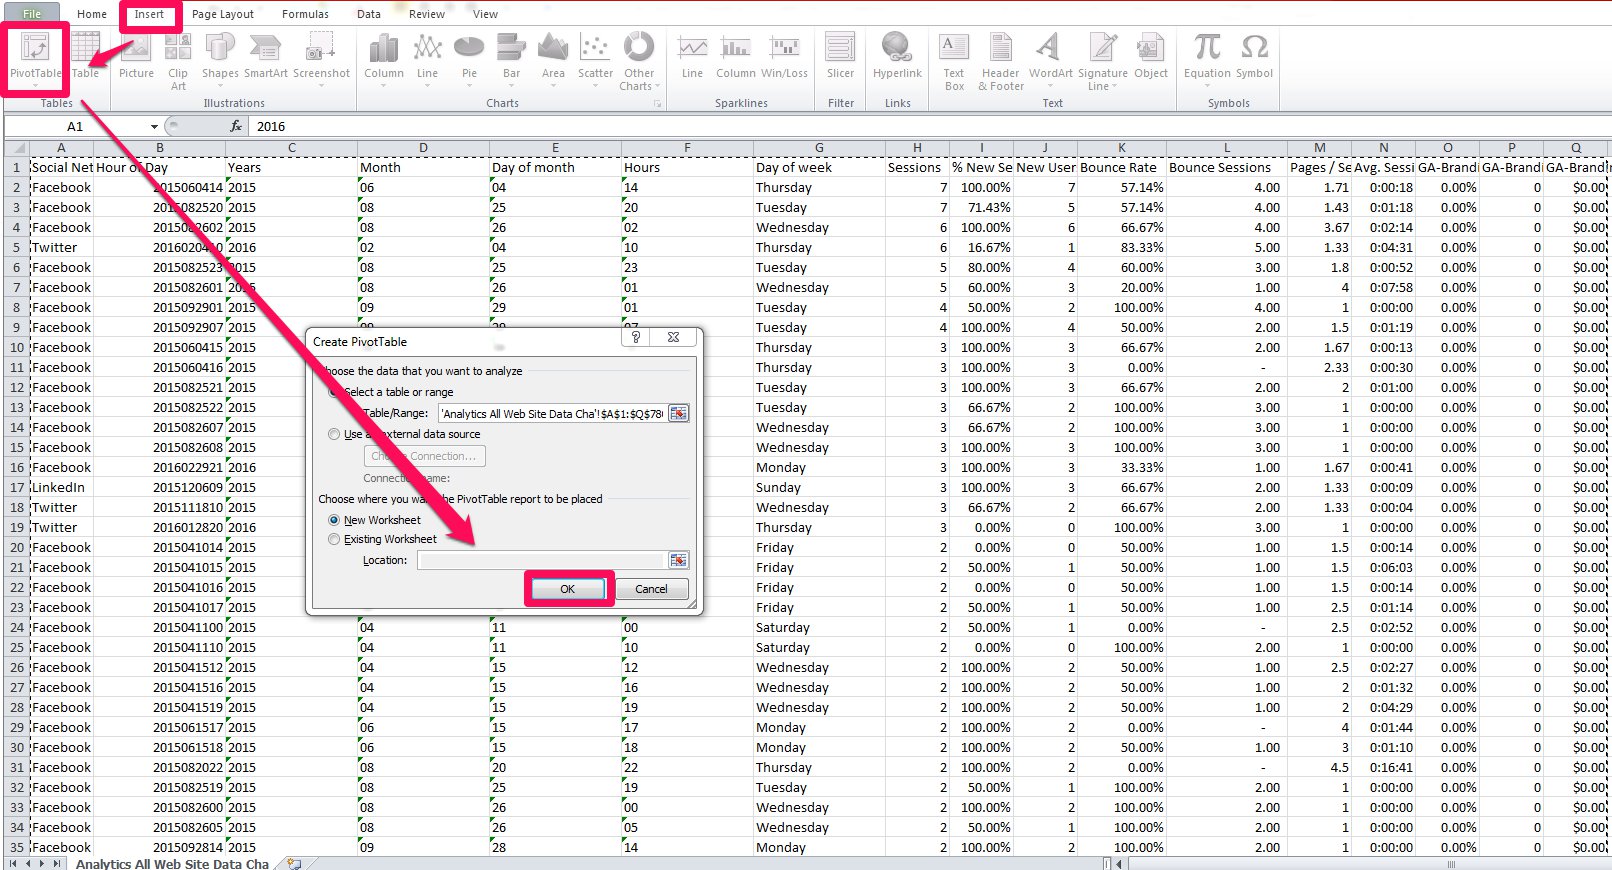
14. Choose all cell -> Insert Tab -> Pivot Table -> OK
15. Drag and drop fields to add to report
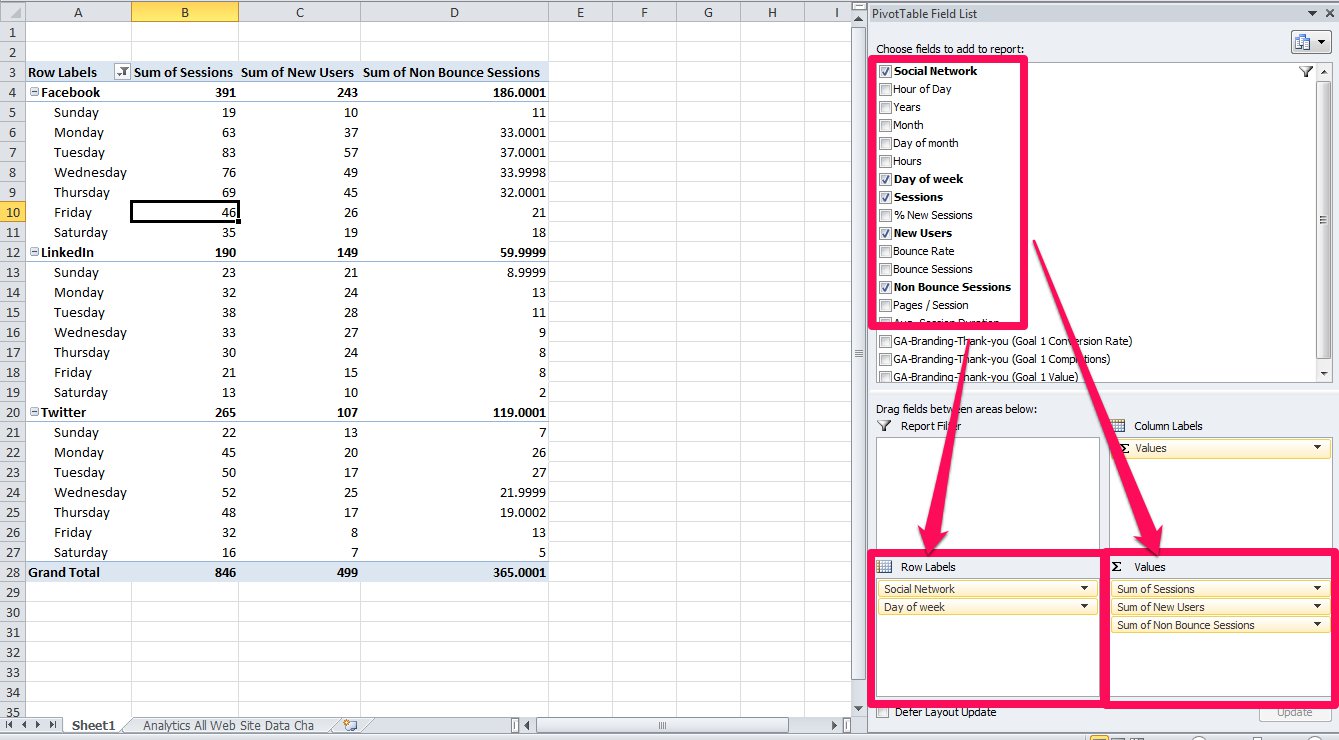
16. Choose the cell in the pivot table -> Insert Tab -> Column
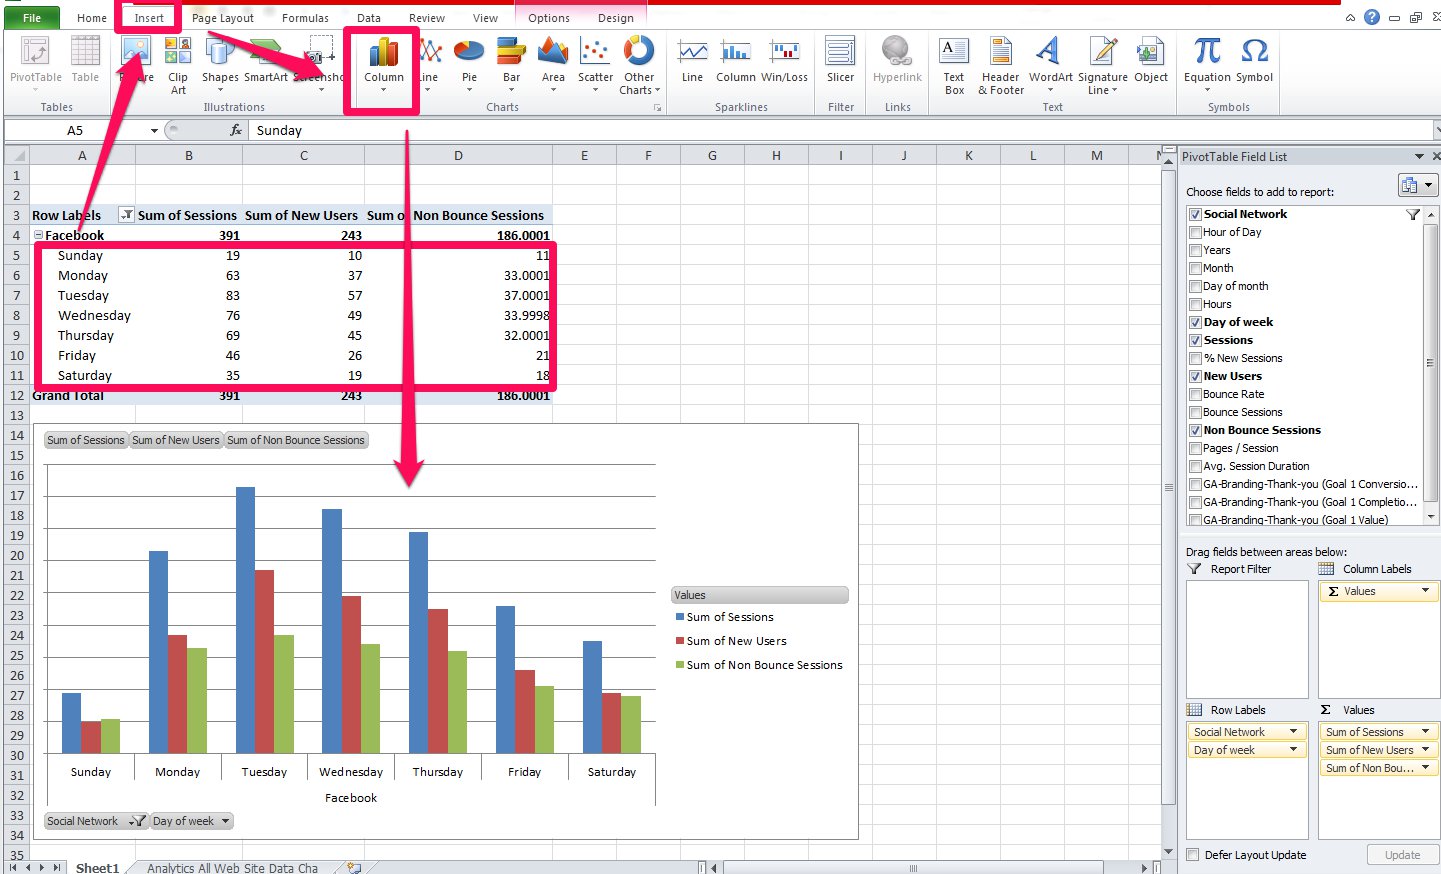
Oh my lord, you’re done! Congratulations, you’ve made it!
Wrapping it Up!
You may get different stats and metrics from what I’ve shown here. That would be another angle to revamp your social media campaign! Your next step would be to adjust your editorial calendar for social media to the stats you pulled off your own social media campaigns. If you need any help with social media marketing, let us know.